Introduction
Health Check Dashboard provides a view of the health of the selected Environments. Click an Environment to see the health of the Environment over the past 24 hours and 7 days and any associated TECRs and TEBRs.
Any health status recorded in Plutora will only be valid for 7 days. If no updates are received within 7 days, the current status will default back to No Data.
Pre-requisite
- To view and access the Health Check Dashboard, you must have ‘View Environment Health Check’ user permission.
- To be able to create and delete the public query builder on the Health Check Dashboard you must have ‘Create/Delete Health Check Dashboard Public Query Builder’ user permission.
- If Health Check Dashboard does not appear under the Environment menu, enable it in Environment Setup.
Navigation
Environment > Health Check Dashboard
Set Up Health Check Dashboard
Environment Setup Customization
To enable the Health Check Dashboard:
- Go to Settings
 > Customization > Environments.
 - Click Environment Setup.
- Click to select Enable Health Check checkbox.
- Click
 .
.
A confirmation message displays. If you click away from the Customization page without clicking ![]() , your changes will not save.
, your changes will not save.
Update Environment Health Check Statuses via External APIs
See the Swagger article for how to generate a token and use Swagger to access Plutora’s external APIs.
The following API endpoints can be used to update Health Check Statuses:
- POST /environmentHealthCheck: Populates the data in the Environment Health Check panel and Health Check Dashboard. Include the following data:
- Test Name.
- Status.
- An optional Log File or Test File as a text file attachment.
- POST /environmentHealthCheck/FullHistory
- POST /environmentHealthCheck/CurrentStatus
The following sample Integration Hub script will allow users to update their Environment Health Check Status via the API:
					/*
This script will connect to Plutora using Oauth 2.0 Authentication and retrieve a list of environments to be based on the search parameters defined in the Plutora UI.
It will then console.log the response to the execution log in Plutora.

This script uses credentials that are defined in Plutora UI as Job Parameters. Refer to the knowledge base in Plutora for more information on adding parameters
To execute this script on your own instance of Plutora, create a new Job, upload the script and define the parameters in the Plutora UI as follows (Note the parameter names are case sensitive):

- oauthurl = <This is the oauth url of your instance of Plutora>
- apiUrl = <This is the API url of your instance of Plutora>
- username = <This is the user email to authenticate with your instance of Plutora>
- password = <This is the user password to authenticate with your instance of Plutora>
- clientId = <This is the API client ID to authenticate with your instance of Plutora>
- clientSecret = <This is the API client secret to authenticate with Plutora>
- filterProperty = <This is the name of the field used to filter the list of Environment>
- filterValue = <This is the field value used to filter the list of Environment>
- filterOperator = <This is the operator used to filter the list of Environment>
*/
/********************************************************
*************STEP 1: Import npm's************************
********************************************************/
const fs = require('fs');
const https = require('https');
const uuid = require('uuid/v4');
const querystring = require("querystring");
/********************************************************
*******STEP 2: Define you API and SSH parameters*********
********************************************************/
const params = {
    auth: {
      server: {
        hostname: '',
      },
      client_id: '',
      client_secret: '',
      grant_type: '',
      username: '',
      password: '',
    },
    api: {
      server: {
          hostname: '',
      },
      pagination: {
        pagenum: 0,
        limit: 1
      },
      filter: {
        property: '',
        direction: '',
        value: '',
        operator: '',
      }
    },
  };

/********************************************************
****STEP 3: Create an API Request function********
********************************************************/
const makeRequest = function (options, payload = '') {
  return new Promise(function (resolve, reject) {
    let req = https.request(options, (res) => {
      let body = "";
      res.on("data", data => {
        body += data;
      });
      res.on("end", () => {
        if (res.statusCode >= 200 && res.statusCode < 300) {
            resolve(body);
        }
        else {
            reject(body);
        }
      });
    });
    req.on('error', (e) => {
      console.error(e.message);
      reject(e);
    });

    req.write(payload);
    req.end();
  });
};

/********************************************************
****STEP 4: Define all the API requests required ********
********************************************************/
// API Call to Get Plutora oauth token
const getAuthToken = function (authParams) {
  const postData = querystring.stringify({
    client_id: authParams.client_id,
    client_secret: authParams.client_secret,
    grant_type: authParams.grant_type,
    username: authParams.username,
    password: authParams.password
  });

  const options = {
    hostname: authParams.server.hostname,
    path: '/oauth/token',
    method: 'POST',
	  rejectUnauthorized: false,
    headers: {
      'Content-Type': 'application/x-www-form-urlencoded',
      'Content-Length': postData.length
    }
  };

  return makeRequest(options, postData).then((data) => {
    return JSON.parse(data);
  });
};


// API Call to Get the list of existing environments
const getEnvironments = function (apiParams) {
  const filterValue = querystring.escape(apiParams.filter.value);
  const options = {
    hostname: apiParams.server.hostname,
    path: `/Environments?filter=%60${apiParams.filter.property}%60%20${apiParams.filter.operator}%20%60${filterValue}%60&pageNum=${apiParams.pagination.pagenum}&recordsPerPage=${apiParams.pagination.limit}`,
    method: 'GET',
	  rejectUnauthorized: false,
    headers: {
      'Content-Type': 'application/json',
      'Authorization': 'Bearer ' + apiParams.auth_token
    }
  };

  return makeRequest(options);
};

const createLogFile = function (prefix) {
  const logLines = 'This is just a sample log file.\n' +
    'Console log: Starting environment health check\n' +
    'Console log: Health check in progress...10% complete\n' +
    'Console log: Health check in progress...50% complete\n' +
    'Console log: Health check in progress...100% complete\n';

  const fileName = `${prefix}-log.txt`;
  fs.writeFileSync(`/${fileName}`, logLines);
  return fileName;
};

// API Call to Create a health check record for each environments retrieved
const checkEnviromentHealth = function (id) {
    // Replace this with the actual health check function
    // Statuses: 0 - Unknown, 1 - Online, 2 - Offline, 3 - Issue
    const logFileName = createLogFile(`env-${id}-${new Date().toISOString()}`);
    if (id) {
        return {logFile: logFileName, status: 1 }
    } else {
        return {logFile: logFileName, status: 0 }
    }
};

// Create health check records for each environment
const createHealthCheckRecords = function (apiParams, record) {
  const testName = `test-via-inthub-at-${new Date().toISOString()}`;
  const boundary = uuid(); // Generate a random id
  const fileContent = fs.readFileSync(`/${record.logFile}`, 'utf8');
  const logFileName = record.logFileName;
  const newLine = '\r\n';

  // The 2 dashes at the start and end of the boundary are required. Do NOT remove.
  const payload = `--${boundary}${newLine}Content-Disposition: form-data; name=\"environmentId\"${newLine}${newLine}${record.environmentId}${newLine}` +
    `--${boundary}${newLine}Content-Disposition: form-data; name=\"health\"${newLine}${newLine}${record.status}${newLine}` +
    `--${boundary}${newLine}Content-Disposition: form-data; name=\"testName\"${newLine}${newLine}${testName}${newLine}` +
    `--${boundary}${newLine}Content-Disposition: form-data; name=\"logFile\"; filename=\"${logFileName}\"${newLine}Content-Type: text/plain${newLine}${newLine}` +
    `${fileContent}${newLine}--${boundary}--${newLine}`;

  const options = {
    hostname: apiParams.server.hostname,
    path: '/environmenthealthcheck',
    method: 'POST',
	  rejectUnauthorized: false,
    headers: {
      'Authorization': `Bearer ${apiParams.auth_token}`,
      'Content-Type': `multipart/form-data; boundary=${boundary}`,
    },
    body: payload,
  };

 return makeRequest(options, payload);
};

/********************************************************
********STEP 5: Define the main run function ************
********************************************************/
const run = async function (args) {
	const params = {
    auth: {
      server: {
        hostname: args.arguments.oauthurl,
      },
      client_id: args.arguments.clientId,
      client_secret: args.arguments.clientSecret,
      grant_type: 'password',
      username: args.arguments.username,
      password: args.arguments.password,
    },
    api: {
      server: {
        hostname: args.arguments.apiUrl,
      },
      pagination: {
        pagenum: 0,
        limit: 100
      },
      filter: {
        property: args.arguments.filterProperty,
        direction: "ASC",
        value: args.arguments.filterValue,
        operator: args.arguments.filterOperator,
      }
    },
  };

  return new Promise(async (resolve, reject) => {
	  console.log('Retrieving authentication token...');
    const authToken = await getAuthToken(params.auth);

    const parameters = {...params.api, ...{auth_token: authToken.access_token}};
    console.log(`Filter settings: property=${parameters.filter.property} | keyword=${parameters.filter.value} | operator=${parameters.filter.operator}`);

    let environments = [];
    let healthCheckResults = [];
    let complete = false;

    while (!complete) {
        console.log(`Fetching page ${parameters.pagination.pagenum} of environments...`);

        const pagedResult = JSON.parse(await getEnvironments(parameters));
        if (pagedResult.resultSet.totalCount === 0) {
            complete = true;
        }

        pagedResult.resultSet.forEach(item => {
            environments.push({id: item.id, name: item.name});
        });

        complete = isAllRecordsFetched(parameters.pagination, pagedResult);
        if (complete) {
            console.log('All environments have been fetched.')
        };

        parameters.pagination.pagenum++;
    }

    for (const env of environments) {
      console.log(`Performing health check for environmentId: ${env.id} | environmentName: ${env.name}...`);
      let result = await checkEnviromentHealth(env.id);
      if (result) {
          healthCheckResults.push({environmentId: env.id, environmentName: env.name, status: result.status, logFile: result.logFile});
      }
    }

    for (const record of healthCheckResults) {
      let result = JSON.parse(await createHealthCheckRecords(parameters, record))
      if (result.Status === "Success") {
        console.log(`Health check record successfully created for environmentId: ${record.environmentId} | environmentName: ${record.environmentName}. | Messages: ${result.Messages.join()}`);
      } else {
        console.log(`Failed to create health check record for environmentId: ${record.environmentId} | environmentName: ${record.environmentName}. | Message: ${result.Messages.join()}`);
      }
    }

    console.log('Task complete.')

	  resolve();
    });
};

const isAllRecordsFetched = function (pageInfo, pagedResult) {
  if (pageInfo.pagenum === 0 && pagedResult.totalCount === pagedResult.returnCount) {
    return true;
  }
  if (pageInfo.pagenum >= Math.floor(pagedResult.totalCount / pageInfo.limit)) {
    return true;
  };
  return false;
}

module.exports = {
    run: run
};
Manage Health Check Dashboard
To manage Health Check Dashboard:
- Go to Environment > Health Check Dashboard. Health Check Dashboard displays nothing when first opened but remembers the previously selected filter from then on.
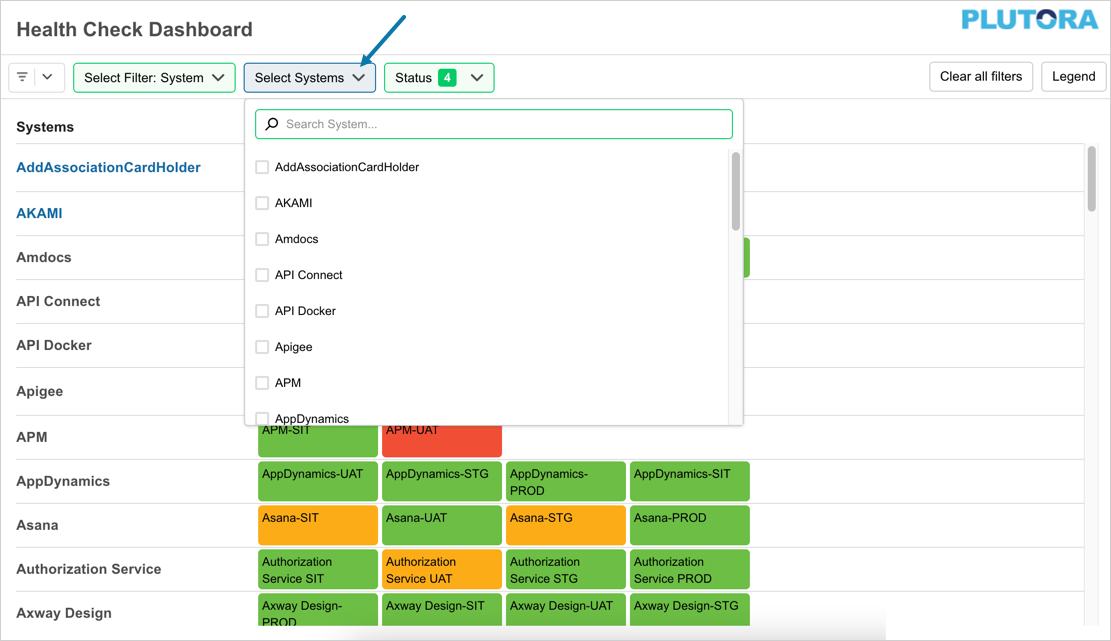
- Click Select Filter. Available filters are:
- Environments: This option will allow you to display a list of environments on the dashboard.
- Environment Groups: Select to display all the Environments in the selected Environment Groups.
- Systems: Select to display all the Environments in the selected Systems.
- Selecting a filter on ‘Select Filter’ displays a context-relevant list for you to choose from. Select the options from the list, as required, to view on the dashboard
- System: The ‘Select Systems’ drop-down displays a list of all the systems to choose from.
- Environment: The ‘Select Environments’ drop-down displays a list of all the environments.
- Environment Group: The ‘Select Environment Groups’ drop-down displays a list of all the Environment groups.
- Status Filter: Customize the Health Check Dashboard view to your preference using the ‘Status’ filter. It enables you to filter the environments based on their status. For example, to view Environments with an ‘Issue’ or ‘Offline’ status only or to exclude Environment with status ‘No Data’, simply select the options from the ‘Status’ drop down.
- Press the Enter key on your keyboard. The environments will display as per the selections.
Color legends:
- Light gray: No data to display:
- No data has been submitted via API.
- Or the status submitted via API was 0 – Unknown:
- If no status updates have been recorded for the last 7 days, the current status will default to No Data.
- Green: Environment is online. The status submitted via API was 1 – Online.
- Amber: Environment has an issue. The status submitted via API was 3 – Issue.
- Red: Environment is offline. The status submitted via API was 2 – Offline.
To clear the filter applied, click on ![]() on the top right hand side of the page.
on the top right hand side of the page.
Environment health check details
24 hour View
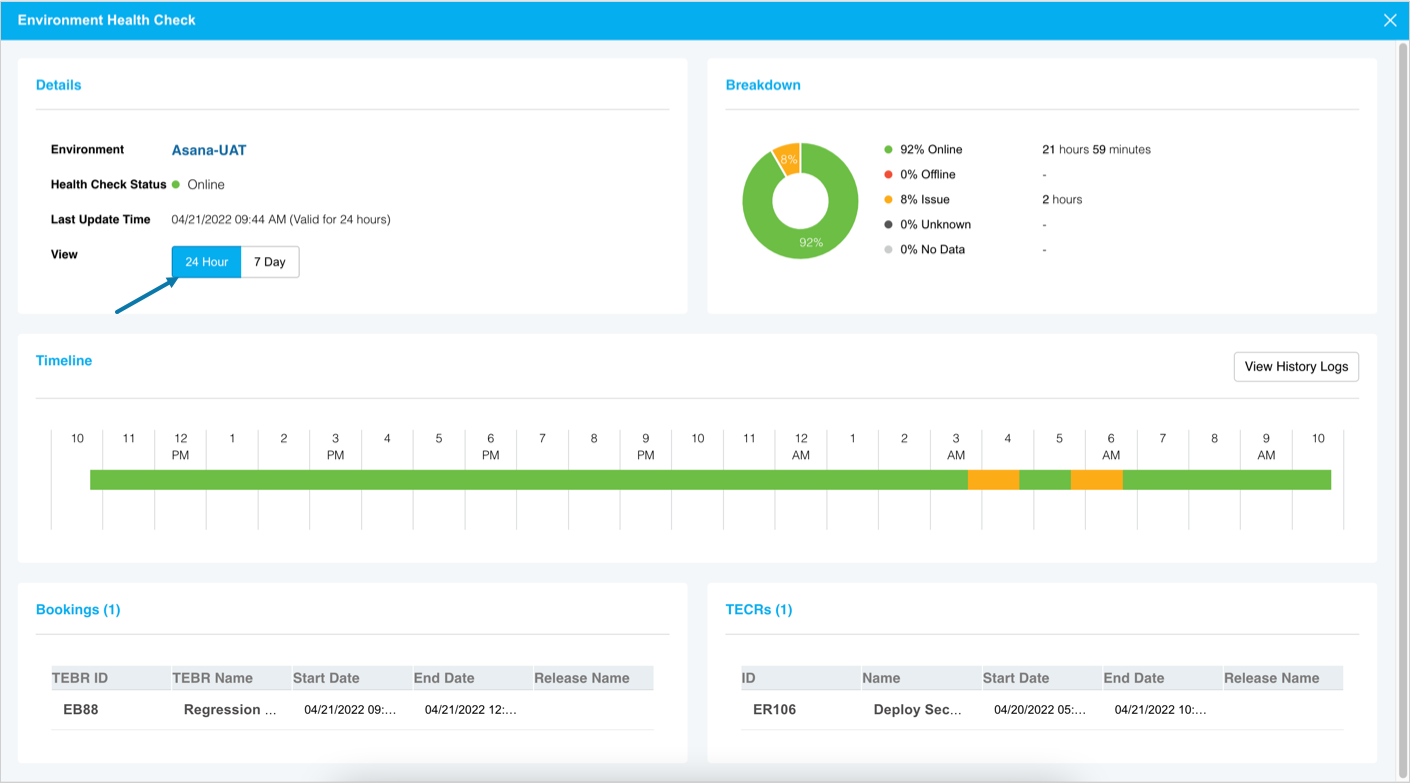
Click an Environment on the HCD to open the Environment health check pop up. Click on 24 hours option to display the environment health check data of the past 24 hours.
The timeline will backfill the most recently recorded status until the previous update, or for the prior 24 hour period if no updates exist for that period.
If the Environment is down, the dates of the TECRs and TEBRs may give a clue as to what brought it down.
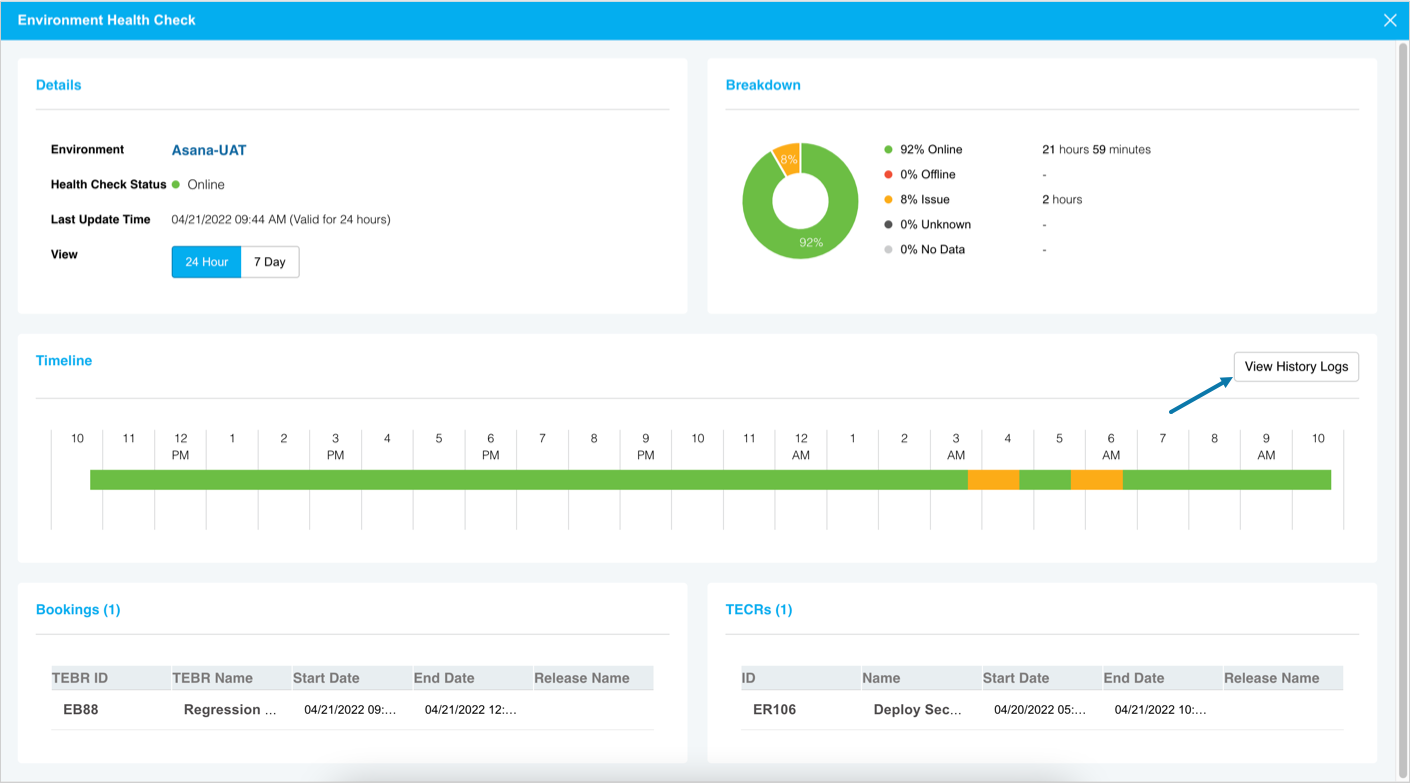
You can view the 24 hour history of the environment’s health by clicking on ![]() .
.
The ‘Environment Health Check History’ pop up opens.
- Clicking View under the ‘Log’ column opens the log file in the browser tab. You can add the log files can via the API.
- The 24-hour history will show a detailed view of all status updates for the past 24 hours. If no updates have been received within a 24-hour period then nothing will be displayed.
Click X to close the ‘Environment Health Check History’ pop-up.
7 day View
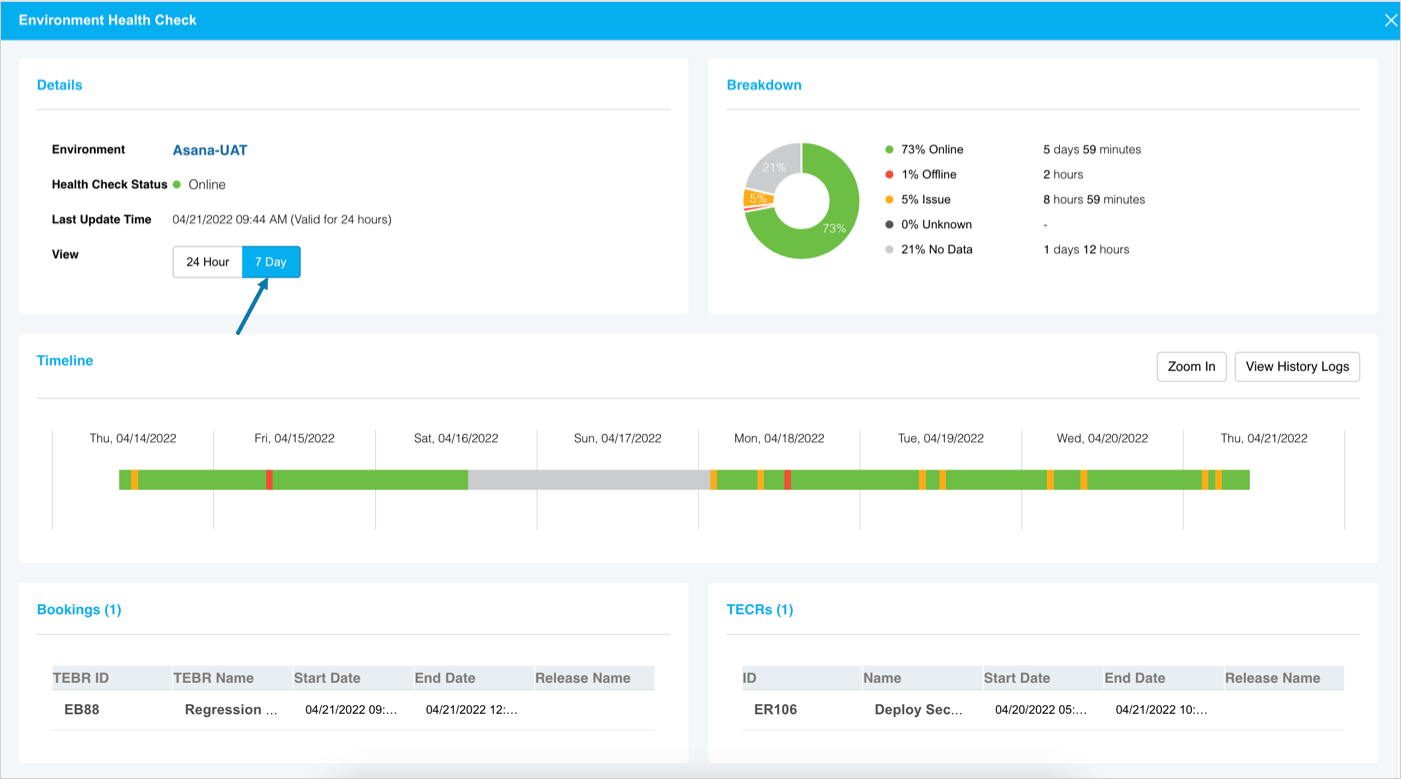
Click 7 Day option to view 7 days’ health check data.
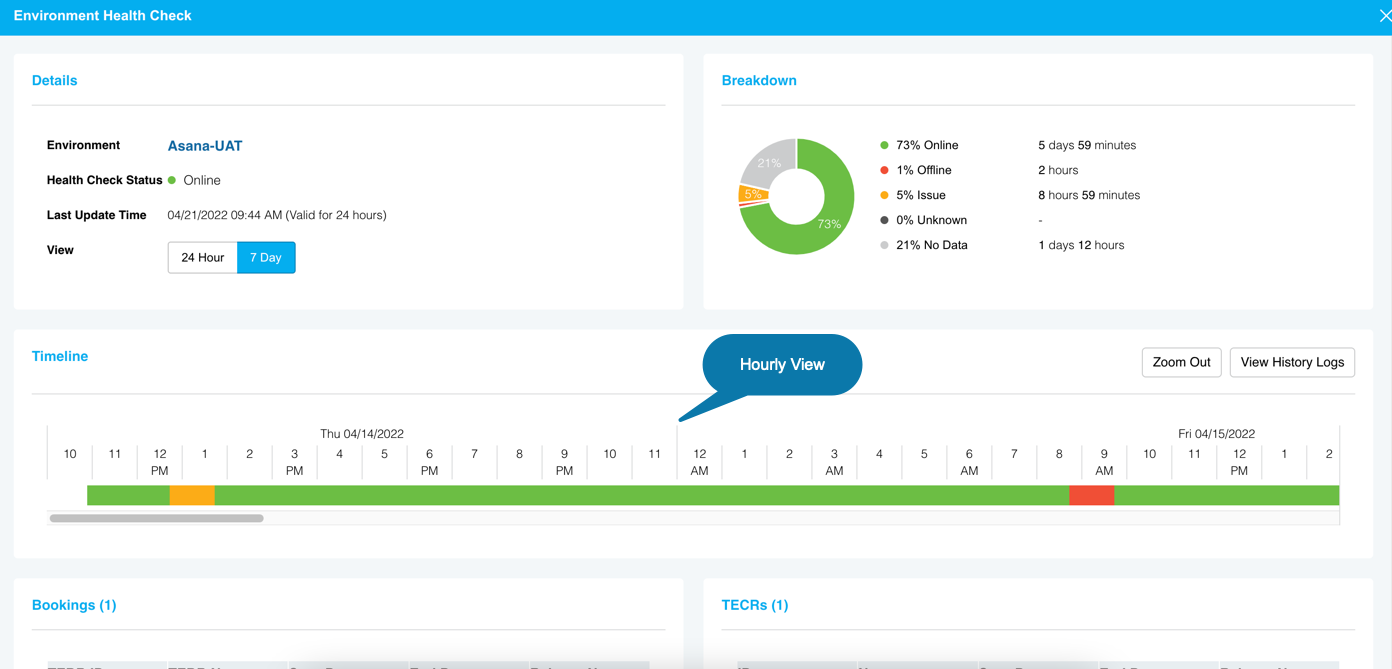
The timeline displays the status of the environment for the prior 7 days period.
Click ![]() to display the hourly view of the Environment Health Check of the past 7 days.
to display the hourly view of the Environment Health Check of the past 7 days.
On this view, the Zoom In button transforms to Zoom Out. Clicking Zoom Out displays the daily view of the Environment Health Check of the past 7 days.
If the Environment is down, the dates of the TECRs and TEBRs may give a clue as to what brought it down.
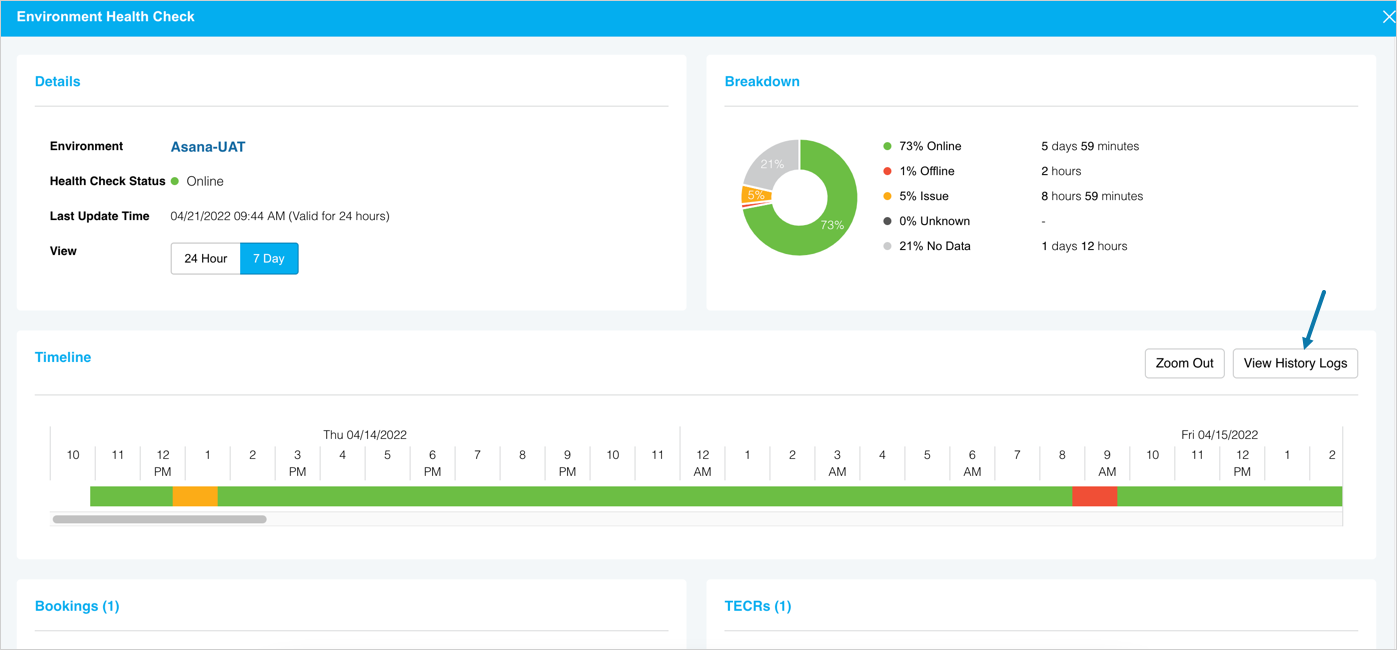
You can view the 7 days’ history of the environment health by clicking on ![]() on this view.
on this view.
The Environment Health Check History pop-up opens and displays the 7 days log.
- Clicking View under ‘Log’ opens the log file in the browser tab. Log files can now be added via the API.
- The history will show a detailed view of all status updates for the past 7 days. If no updates have been received within this period then nothing will be displayed.
Click X to close the Environment Health Check History pop-up.
More Information
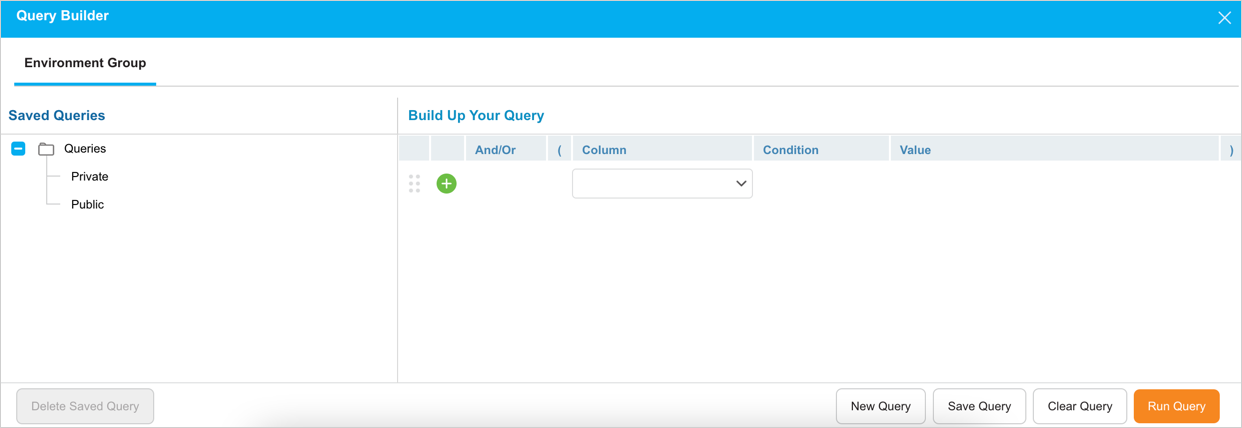
Advanced filters on HCD using Query Builder
Use Query Builder to create advanced filters on multiple fields. This provides you with more options to filter the Environments displayed on the HCD. You can save the Public and Private queries to quickly switch from one set of Environments to another. See Pre-requisite for user permission to add and delete pubic queries.
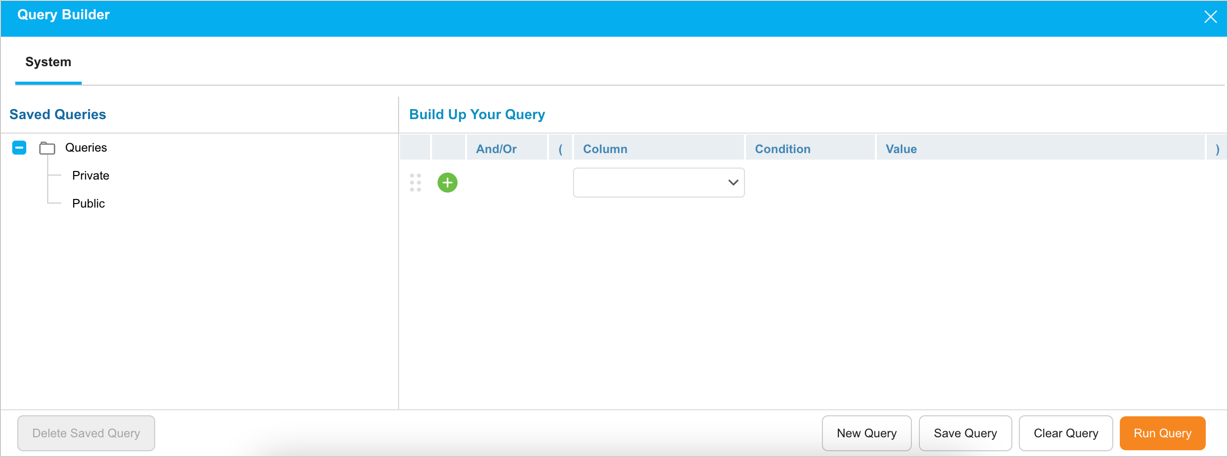
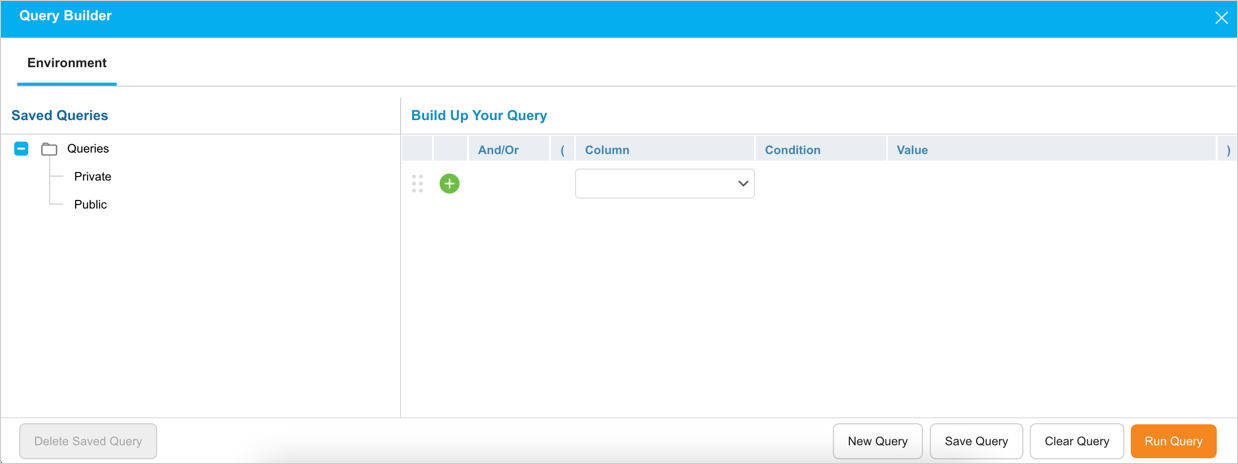
The filter fields in the Query Builder are relative to the selection made in the Select Filter field. For example, selecting Systems on ‘Select Filter’ display ‘System’ specific fields on the Query Builder.
(You must have the ‘Health Check Dashboard Public Query’ user permission to create, edit or delete the public queries.)
- Query builder for ‘System’:
- Query builder for ‘Environment’:
- Query builder for ‘Environment Group’:

