
DevOps Dashboard allows users to track the following KPIs based on DORA’s research:
- Deployment Frequency: How Often Do You Deploy?
- Change Failure Rate: How Well Do You Deploy?
- Lead Time for Changes: How Fast Do You Deploy?
- Mean Time to Recover: How Quickly Do You Fix Problems?
DORA’s research provides insight into software development and DevOps practices applied in industry, backed by scientific studies spanning six years with over 31,000 survey responses from working professionals (DORA, 2019 p. 7).
The … four metrics that capture the effectiveness of the development and delivery process can be summarized in terms of throughput and stability. We measure the throughput of the software delivery process using lead time of code changes from check-in to release along with deployment frequency. Stability is measured using time to restore—the time it takes from detecting a user-impacting incident to having it remediated—and change fail rate, a measure of the quality of the release process (DORA, 2019 p. 16).
Location
To locate the DevOps Dashboard:
- Go to Reporting > Analytics > Explore > Generic > DevOps Dashboard.
Or:
Go to Reporting > Analytics and search for DevOps Dashboard.
Layout
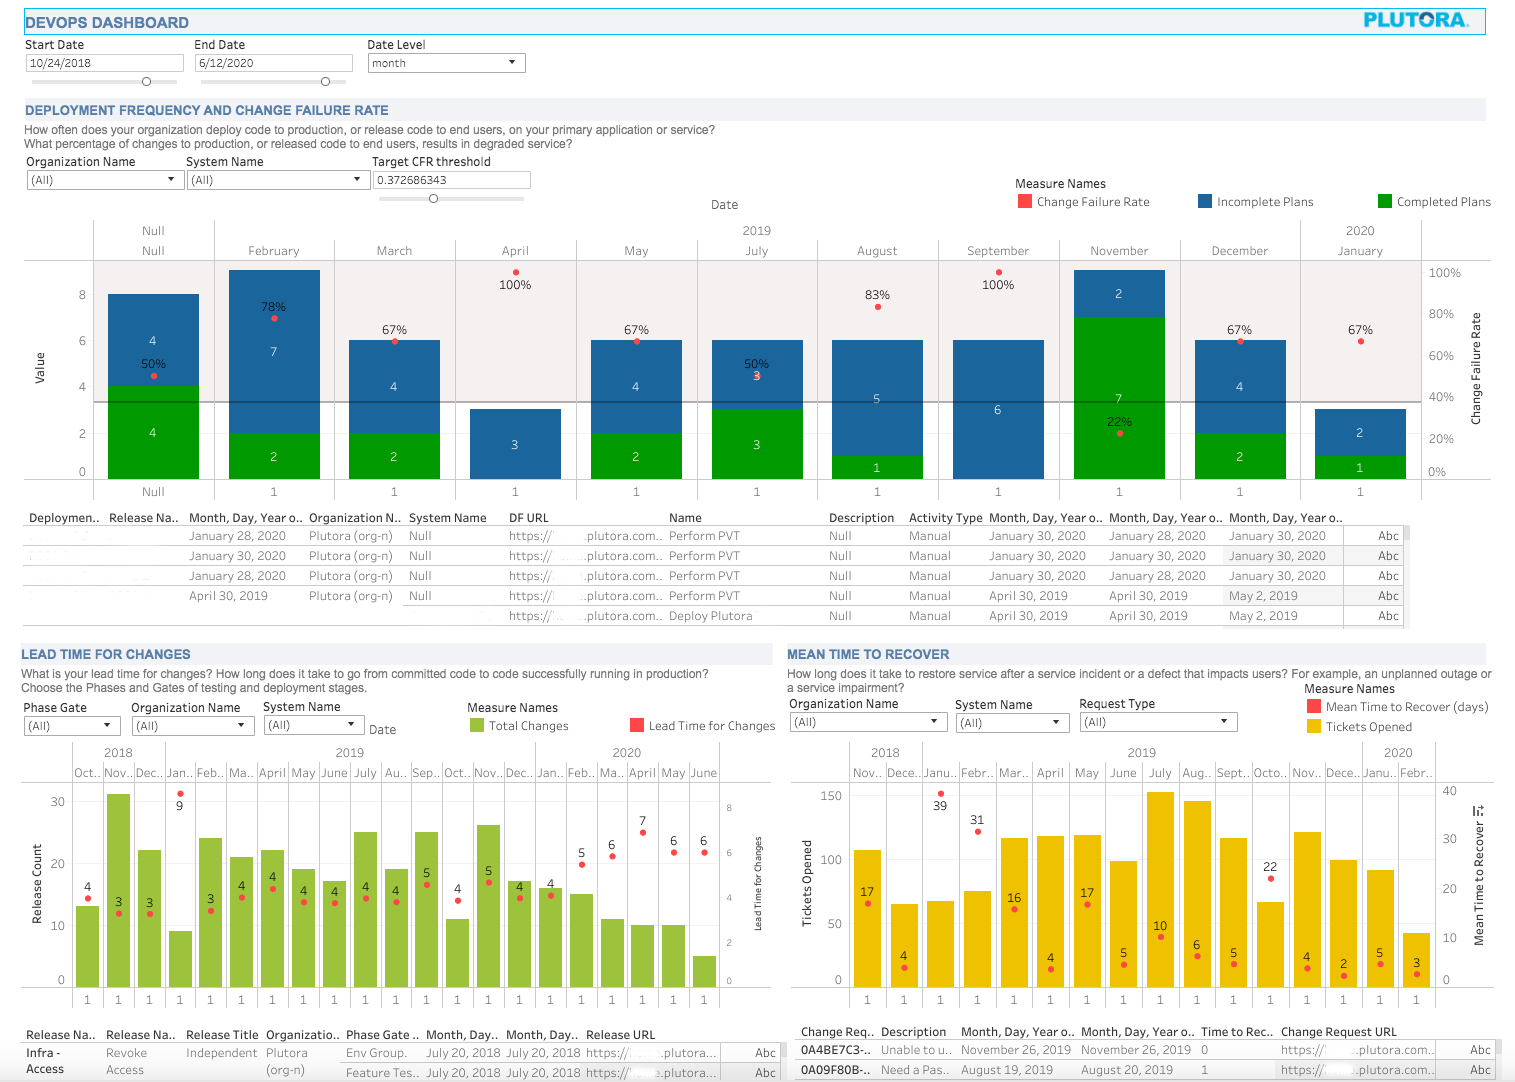
![]()
The top section of the DevOps Dashboard allows the user to filter the rest of the dashboard by:
- Start Date:
- Set the Start Date by moving the slider.
- End Date:
- Set the End Date by moving the slider.
- Date Level (the time period that will appear in the dashboard):
- Day.
- Month.
- Year.
How the DevOps Dashboard Displays the Four DORA KPIs
1. Deployment Frequency
Location and Filters
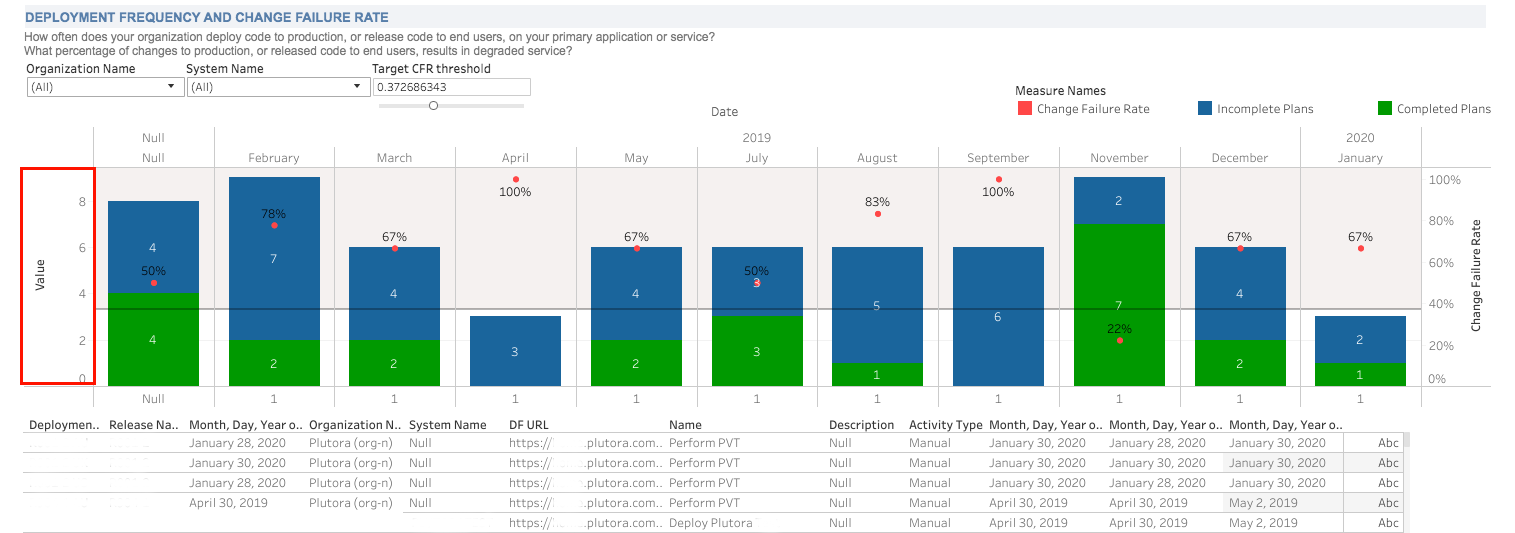
Deployment Frequency is located in the top graph of the DevOps Dashboard with the:
- Y-axis on the left showing the number of Deployment Plans.
- Columns showing the number of Deployment Plans, green for completed and blue for incomplete.
Filter by the main dashboard filter and by:
- Organization Name.
- System Name.
Business Questions
How often does your organization deploy code to production?
Key business questions:
- How many deployments, split by the periods, do you plan?
- Are the number of deployments over time increasing or decreasing?
- What status are your deployments on the planned deployment dates?
- How are you progressing over time?
- How are you progressing in the current period, compared to the previous one?
- Should all the statistics be visible by the organization?
- Should all the statistics be visible by the system?
- What timeframe do we consider?
2. Change Failure Rate
Location and Filters

Change Failure Rate is located in the top graph of the DevOps Dashboard with the:
- Y-axis on the right showing the percentage rate.
- Red dots showing the percentage Change Failure Rate.
- Target Change Failure Rate (CFR) Threshold as a gray, horizontal line. The red dot should be below this line:
- Set Target CFR Threshold by moving the slider.
For the Target Change Failure Rate: 0–15% is considered elite to medium quality, and 46–60% is considered low quality (Google, 2019 p. 18).
- Set Target CFR Threshold by moving the slider.
Filter by the main dashboard filter and by:
- Organization Name.
- System Name.
Business Questions
What percentage of changes release to production result in degraded service (for example, a service impairment or service outage) and require remediation (for example, a hotfix, a rollback, or a patch)?
Key business questions:
- Should a failure happen after a successful deployment?
- Does failure mean that deployment hasn’t happened on time?
- What are the failure types? Critical, Medium, or No Risk?
- What are the correct periods to consider the rate of failure? Day, Week, Sprint, Month, or Year?
- How do we see progress or regress in our failure rate?
3. Lead Time for Changes
Location and Filters
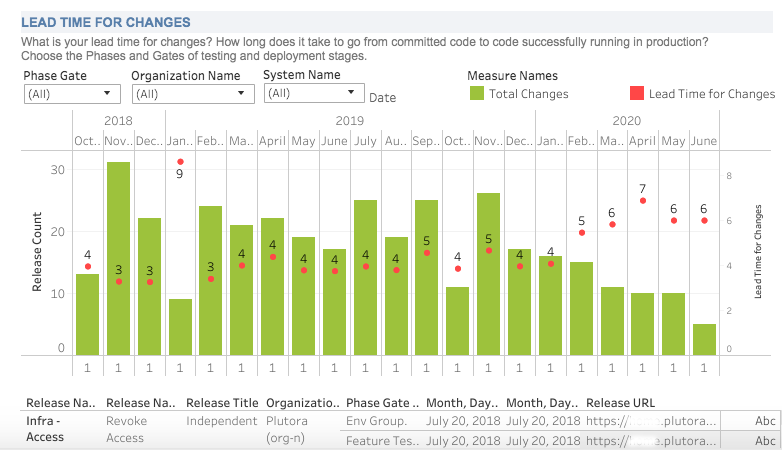
Lead Time for Changes is located in the bottom-left graph of the DevOps Dashboard with the:
- Y-axis on the left showing the number of affected Releases in the time period selected by Date Level.
- Y-axis on the right showing the number of days of lead time.
- X-axis showing the selected period by Date Level. In the screenshot above, the month and year on top and the number of months (1) on the bottom.
Filter by the main dashboard filter and by:
- Phase Gate:
- Select the Phase or Gate where code has been committed.
- Organization Name.
- System Name.
Business Questions
How long does it take you to get your committed code running in production?
Key business questions:
- How do we know that the code has been committed?
- Select the Phase or Gate where the code has been committed.
- How many changes have been committed and deployed?
- When should we place the timestamp? When code is committed or when code is deployed?
4. Mean Time to Recover
Location and Filters

The time to restore service is represented by Mean Time to Recover in the bottom-right graph of the DevOps Dashboard with the:
- Y-axis on the left showing the number of tickets opened.
- Y-axis on the right showing the mean time to recover in hours.
- X-axis showing the selected period by Date Level. In the screenshot above, the month and year on top and the number of months (1) on the bottom.
Filter by the main dashboard filter and by:
- Organization Name.
- System Name.
- Request Type.
Business Questions
How long does it take you to restore service when a service incident or defect that impacts users occurs?
Key business questions:
- How do we define the failure?
- Do we attach the failure to the day of the incident or the day of the final recovery?
- What time units should be used? Days, Hours, or Minutes?
References
DORA (2019). Accelerate: State of DevOps 2019. [PDF] DORA. Available at: https://services.google.com/fh/files/misc/state-of-devops-2019.pdf [Accessed 7 Feb. 2020].
![]()