The Analytics tab, in Release Manager, provides you with a comprehensive view of the progress and status of all release activities and criteria, scope items, TECRs, Bookings, and Deployments plan within your release. At the Enterprise release level, it provides a summary view for the Enterprise release and all Project releases within the release manifest. At the Project and Independent release level, it provides a summary view for that specific release. It gives you:
- the ability to view the progress of Activities and Criteria and identify how many are overdue. This helps ensure the release process is being adhered to during the full life cycle of the release and supports you to make the final Go/No Go decision.
- the ability to see the progress and breakdown by Type of all scope items. This helps ensure that all scope items are in the correct state as you progress through each phase and gate of the release and helps identify any risks to the release schedule due to scope items not being ready for release on time. Scope items that are not in the correct state may need to be removed from the release or the project release needs to be moved to another enterprise release. This also supports you to make the final Go/No Go decision.
- the ability to see the status of all TECRs to know how many are outstanding as well as how many have been completed. As you promote changes to higher-level environments and to production, it enables you to ensure that all TECRs are being approved and executed accordingly.
- the ability to see the status of all bookings to know if any bookings are still Pending as well as how many are Approved/Rejected. This helps during the early stages of a release (e.g. Planning) where one of the first steps is securing Environments.
- the ability to see the status of all Deployment Plans to know how many are in Draft/Approved/Execution/Completed. This provides value towards the end of the Release when preparing for your Production deployment as you can quickly verify all deployment plans have been approved before making your Go/No Go decision.
The Analytics tab also provides value when you are completing a release as you can quickly verify there are no outstanding Activities, Criteria, TECRs, Bookings, or Deployment Plans before setting the release to a completed state.
Pre-requisite
To be able to view the Analytics tab, you must have View Release Manager permission.
Navigation
Release > Manager
Access ‘Analytics’ Tab
To access ‘Analytics’ tab in a release,
- Navigate to Release > Manager.
- Click the Releases toggle button to display the list of available releases.
- Click the Release ID or Release Name to open the release.
- Click Analytics tab.
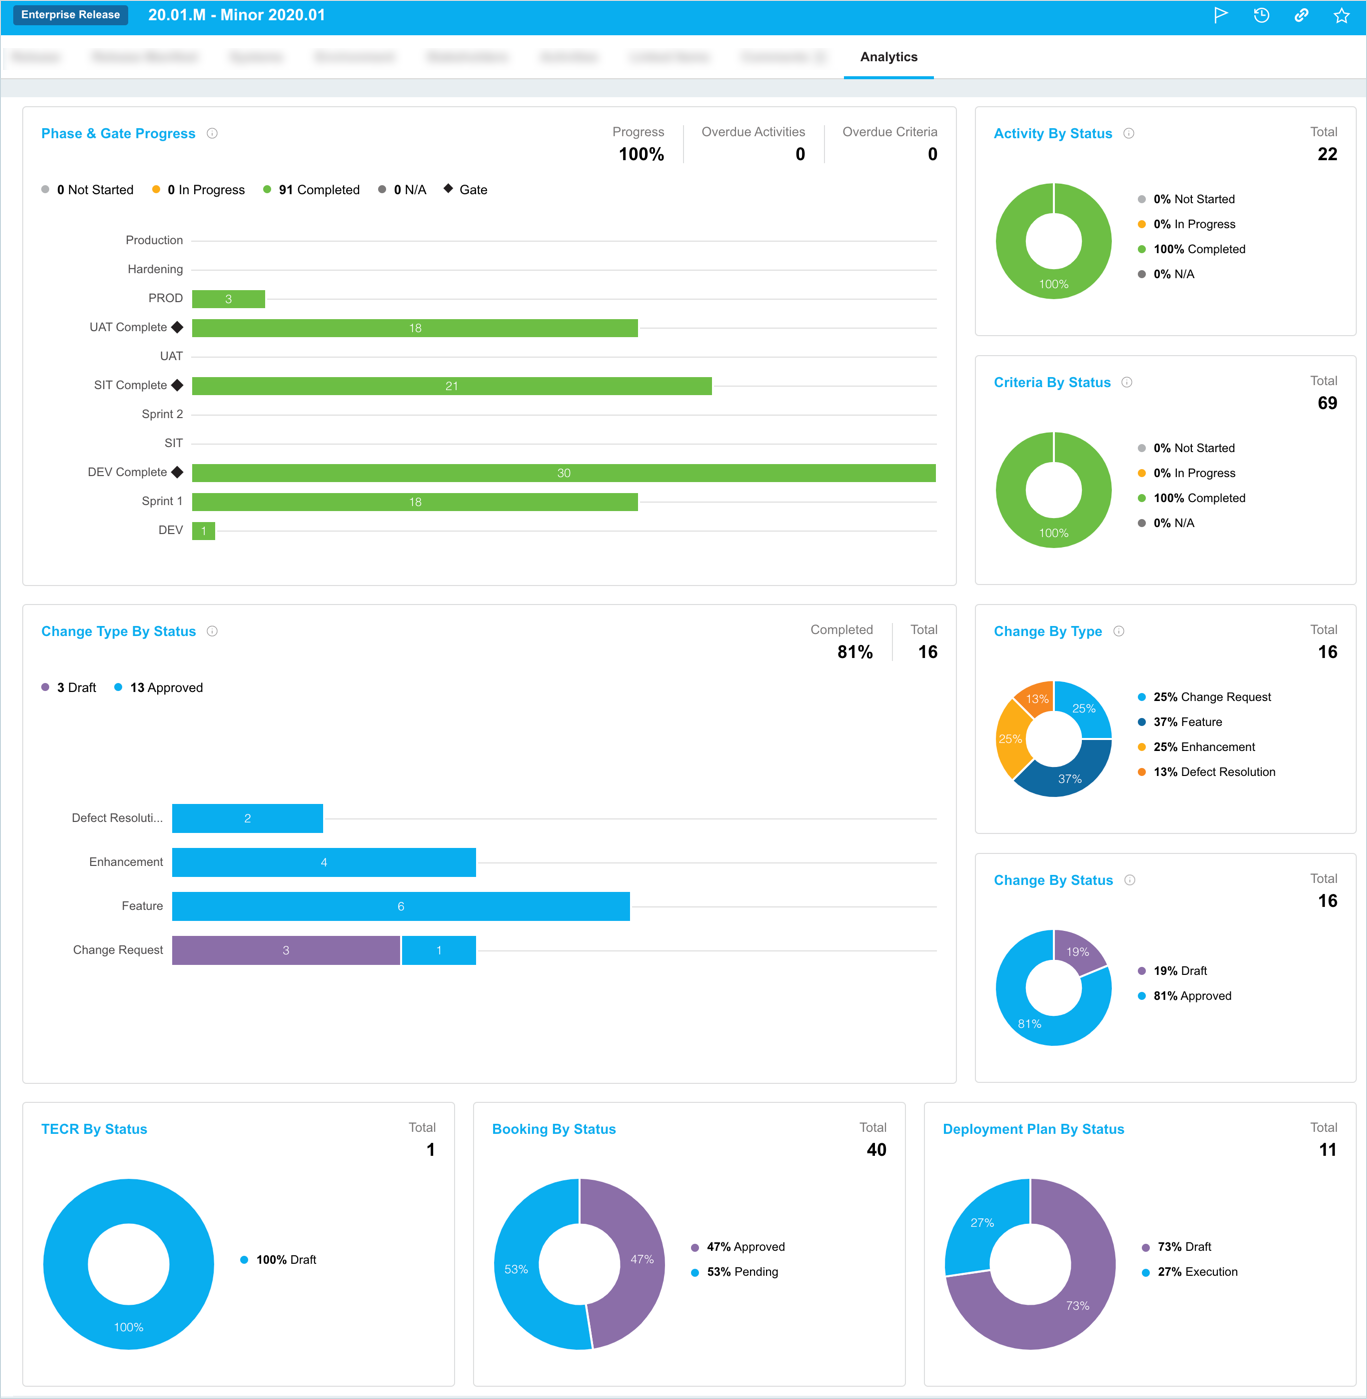
Analytics Tab Charts – In Detail
You can view the following charts in the Analytics tab:

Phase and Gate Progress
This chart shows the summary of the progress of each phase and gate within your Enterprise, project or independent release based on the completion of the Activities and Criteria. The following information is displayed by this chart:
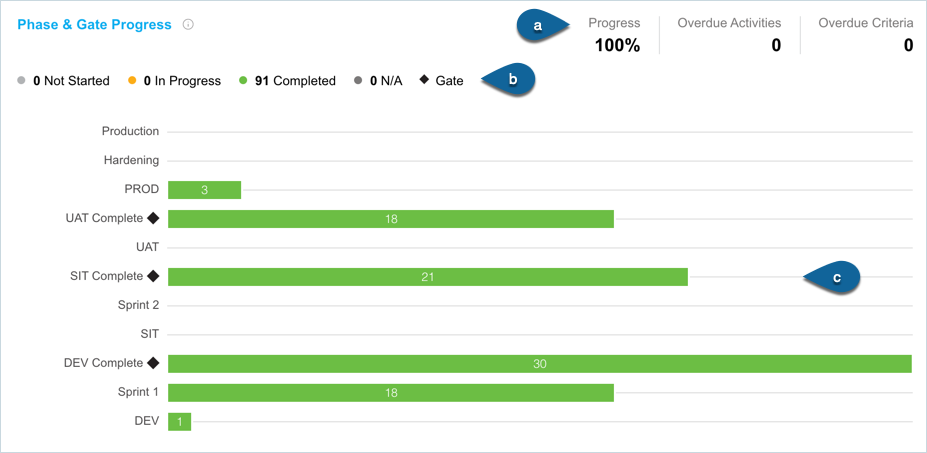
- The overall progress % of the phase and gate and the number of overdue activities and criteria.
- Count of activities per status.
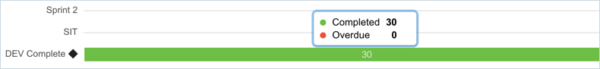
- Summary of the status of activities and criteria per phase and gate as well as the number of overdue activities and criteria. The number in the bar show the count of the activities or criteria in a particular status. Click on the bar to view the count in that status and a count of overdue items.

Activity By Status
Shows the summary of the status of the phase activities within the overall release. You can view the following information on this chart:

- the total number of activities within the release
- the percentage of the activities per status. Hover over the chart to view the count of activities per status.
Criteria By Status
Shows the summary of the status of the criteria within the release. You can view the following information on this chart:
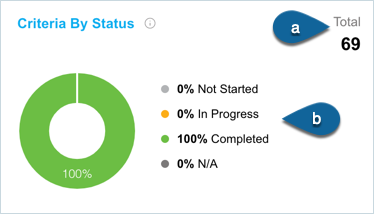
- the total number of criteria within the release
- the percentage of the criteria per status. Hover over the chart to view the count of criteria per status.
User Stories Type By Status
This chart shows the progress of all the scope items within your release. The data displayed is based on the Change status per Change Type. You can view the following information on this chart:
- total number of scope items.
- the count of the scope items by status
- Summary of the scope items by type by status. The number on the bar shows the count of scope items in a particular status.
Change By Type
This chart displays the summary of the scope items per Change Type within the release. You can view the following information on this chart: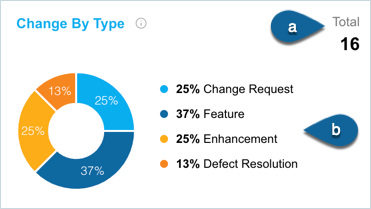
- the total number of scope items within the release.
- the percentage of the scope item per Type. Hover over the chart to view the count of the scope items per Type.
Change By Status
This chart displays the summary of the scope item per Change Status within the release. You can view the following information on this chart: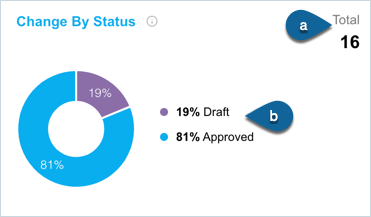
- the total number of scope items within the release.
- the percentage of the scope item per Status. Hover over the chart to view the count of the scope items per Status.
TECR By Status
The chart shows the status of TECRs across all releases within the release. You can view the following information on this chart.
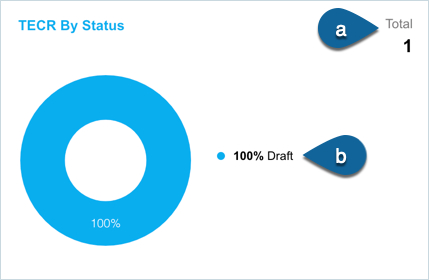
- the total number of TECRs within the release.
- the percentage of the TECR per Status. Hover over the chart to view the count of the TECR per Status.
Booking By Status
This chart shows the status of all bookings across all releases within the release. You can view the following information on this chart:
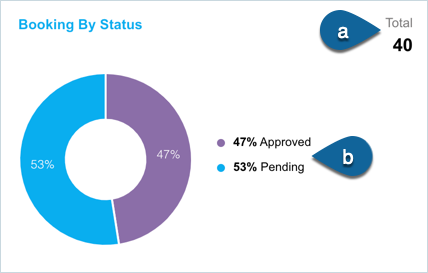
- the total number of Bookings within the release.
- the percentage of the Bookings by Status. Hover over the chart to view the count of the Booking per Status.
Deployment Plan By Status
This chart shows the status of all Deployment Plans within the release. You can view the following information on this chart:
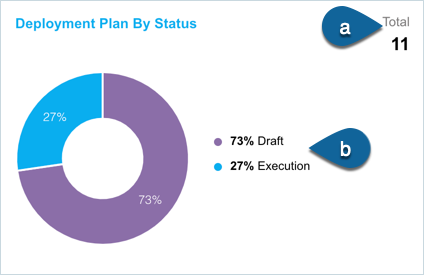
- the total number of deployment plans within the release.
- the percentage of the Deployment Plans by Status. Hover over the chart to view the count of the Deployment Plan per Status.
More Information
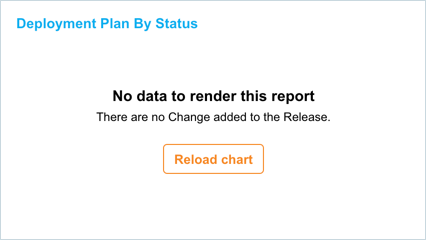
A chart with no data will display ‘No data to render this report’.