
Environment KPIs Dashboard allows users to track key metrics across Environments.
Ask Plutora’s Support to make the Environment KPIs Dashboard appear in your navigation menu.
Location
To locate the Environment KPIs Dashboard:
- Request Plutora Support to add Environment KPIs Dashboard to your navigation menu.
- Go to Environment > Environment KPIs.
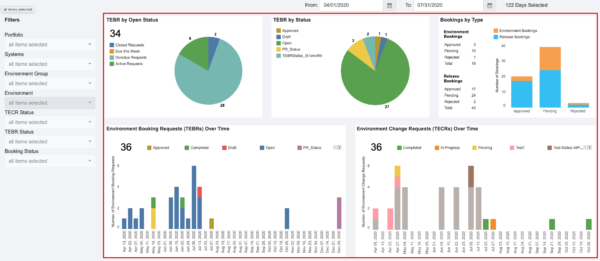
Layout
The Environment KPIs Dashboard displays the following:
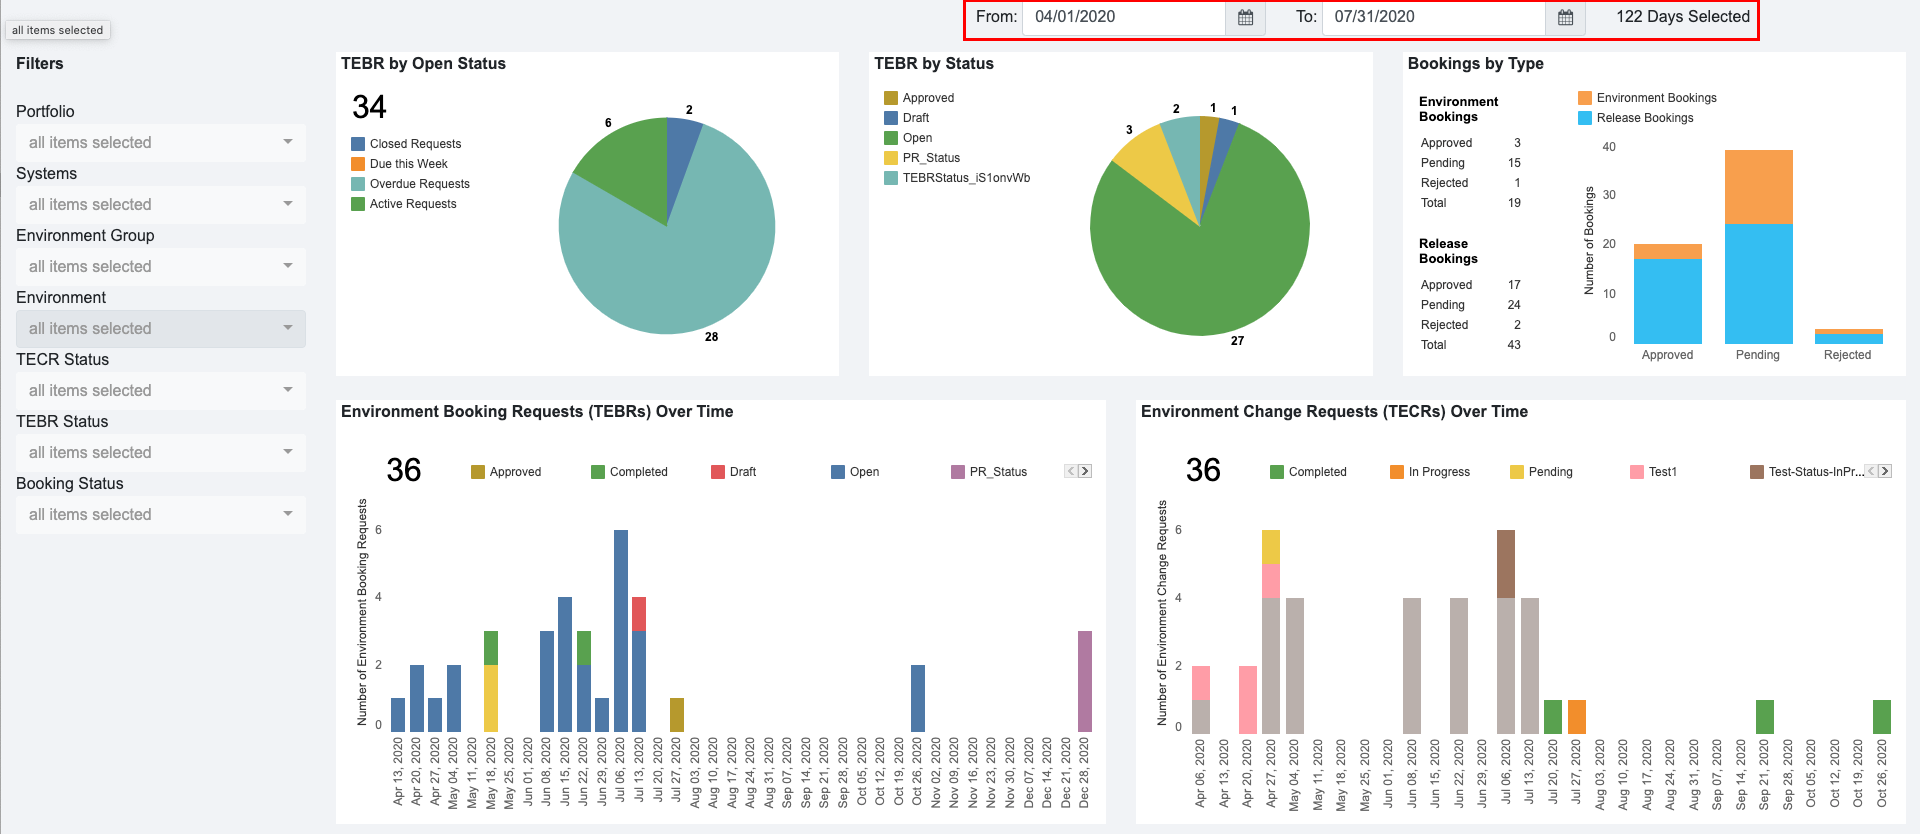
- Date Filters:

- Set the start date (left) and end date (right).
- Other Filters:

- The left sidebar of the Environment KPIs Dashboard allows the user to filter the data in the rest of the dashboard by:
- Portfolio:
- Select by Portfolio Association.
- Systems:
- Select by System.
- Environment Group:
- Select by Environment Group.
- Environment:
- Select by Environment.
- TECR Status:
- Select by TECR Status.
- TEBR Status:
- Select by TEBR Status.
- Booking Status:
- Select by booking status.
- Portfolio:
- The left sidebar of the Environment KPIs Dashboard allows the user to filter the data in the rest of the dashboard by:
- Widgets:
- Each widget shows a different KPI, including:
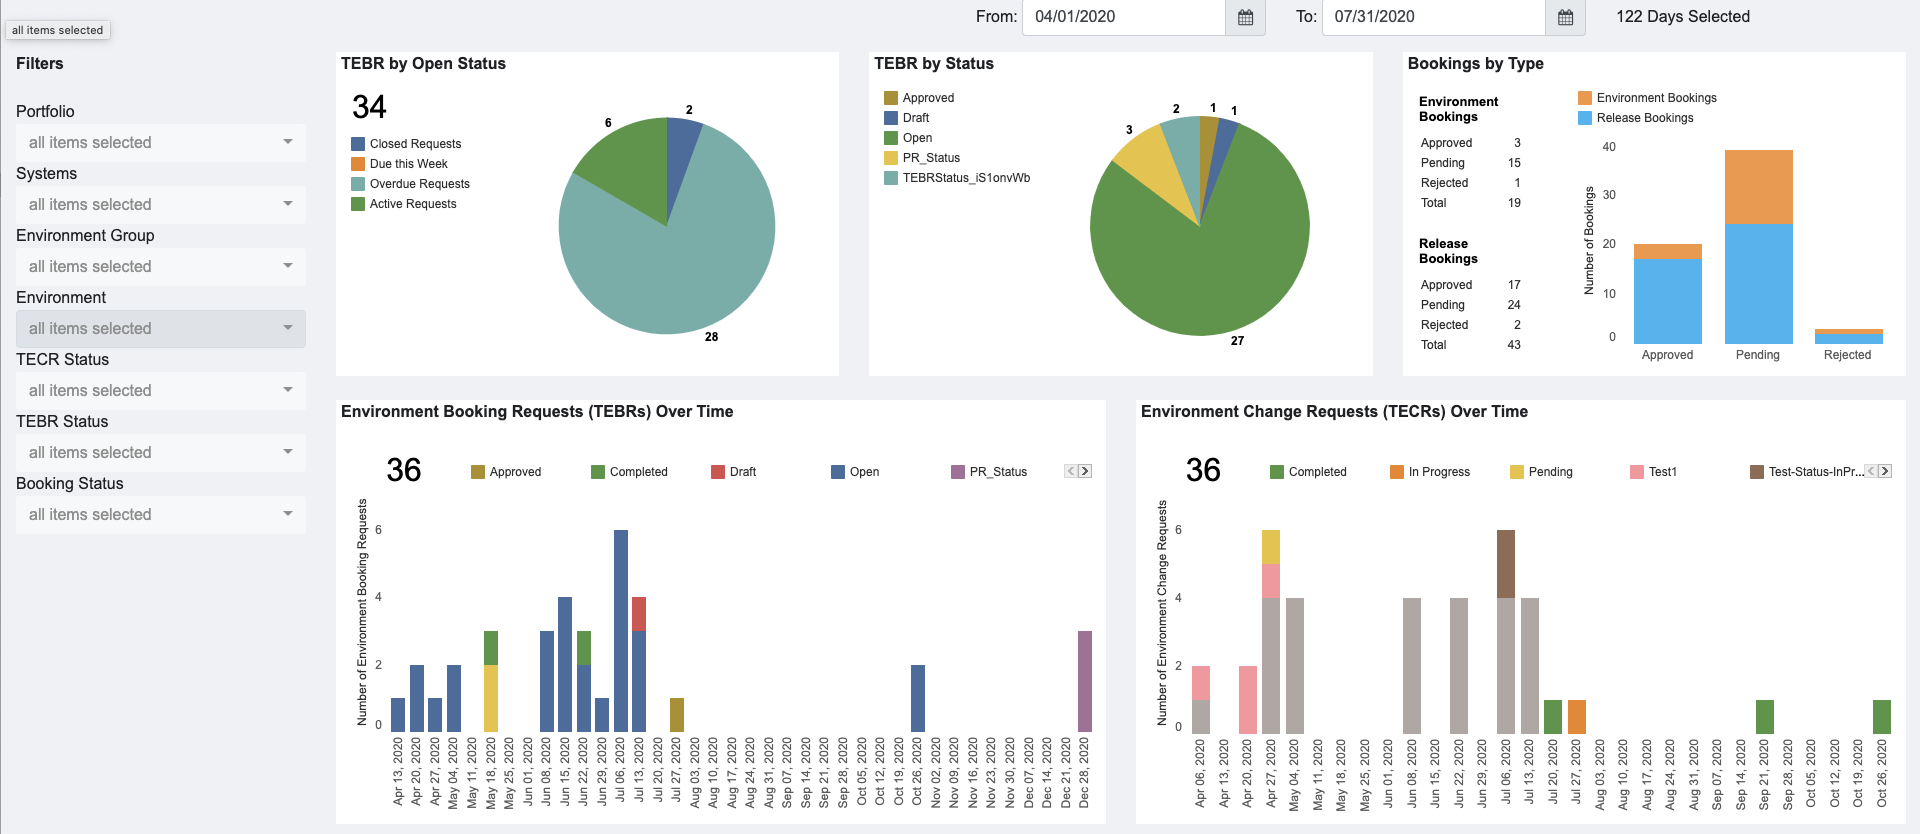
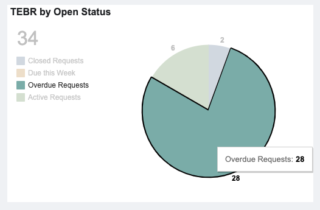
- TEBR by Open Status:
- Statuses are Active, Overdue, Due This Week, and Closed based on the End Date/Time.
- Open requests are Active + Overdue.
- The total (34 in the screenshot above) is the number of Open requests.
- TEBR by Status:
- Data from the TEBR Status Customization.
- Bookings by Type:
- Approved, Pending, or Rejected bookings showing the count of Environment Bookings (TEBRs without a Release) and Release Bookings (TEBRs with a Release or Environments booked in an Enterprise, Project, or Independent Release).
- Environment Booking Requests (TEBRs) Over Time:
- TEBRs with a duration that falls within the selected dates.
- The TEBR Status of those TEBRs is displayed by color.
- Click + or – to see the data monthly, quarterly, or yearly.
- Environment Change Requests (TECRs) Over Time:
- TECRs with a duration that falls within the selected dates.
- The TECR Status of those TECRs is displayed by color.
- Click + or – to see the data monthly, quarterly, or yearly.
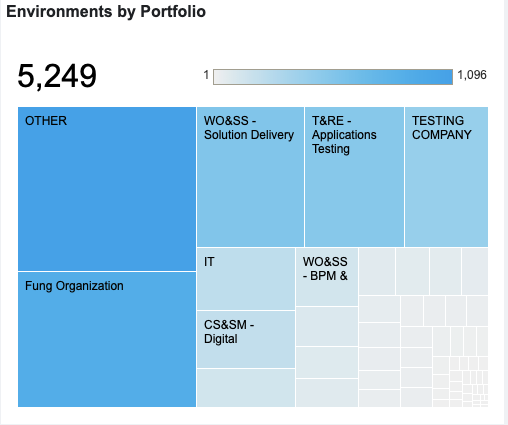
- Environments by Portfolio:
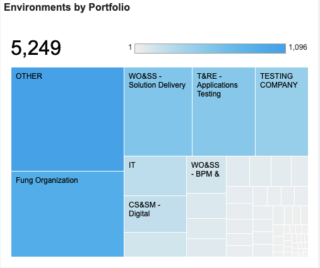
- A tree map showing Portfolio Associations associated with Environments.
- The total (5,249 in the screenshot above) is the number of Environments in the application.
- The gradient bar shows the number of Portfolio Associations represented by the color of each square, the darker the color, the larger the number.
- Click or hover over on each square to see the number of Environments in that Portfolio Association.
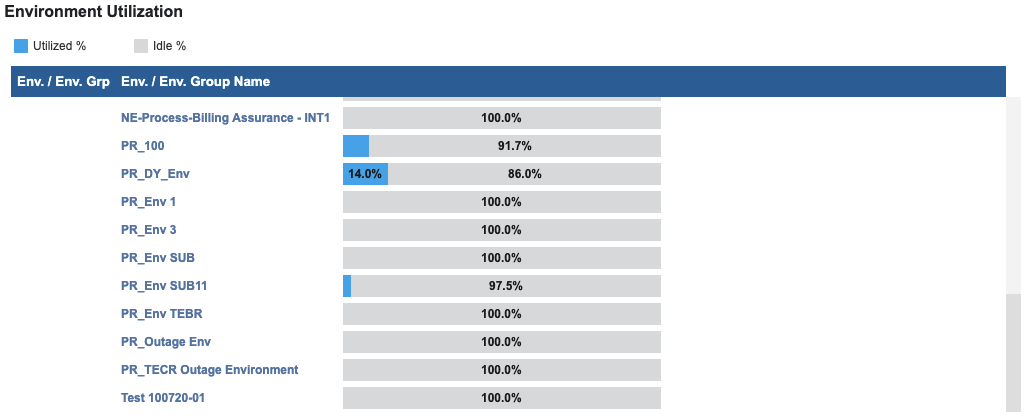
- Environment Utilization:

- The utilization for each Environment across the selected dates.
- Based on the number of hours each Environment can be booked for the selected dates, versus the actual hours booked.
- Blue is booked and gray is idle. Percentages for each are shown.
- Environment Conflicts:
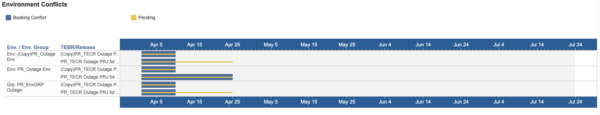
- Environments or Environment groups are listed, with the TEBR or Release they are booked with.
- In the timeline, the blue bars represent the conflicts.
- TEBR by Open Status:
- Click on the sections of each widget graph to display a breakdown of the data in that section. Click again to display all the data.
- Each widget shows a different KPI, including:


![]()