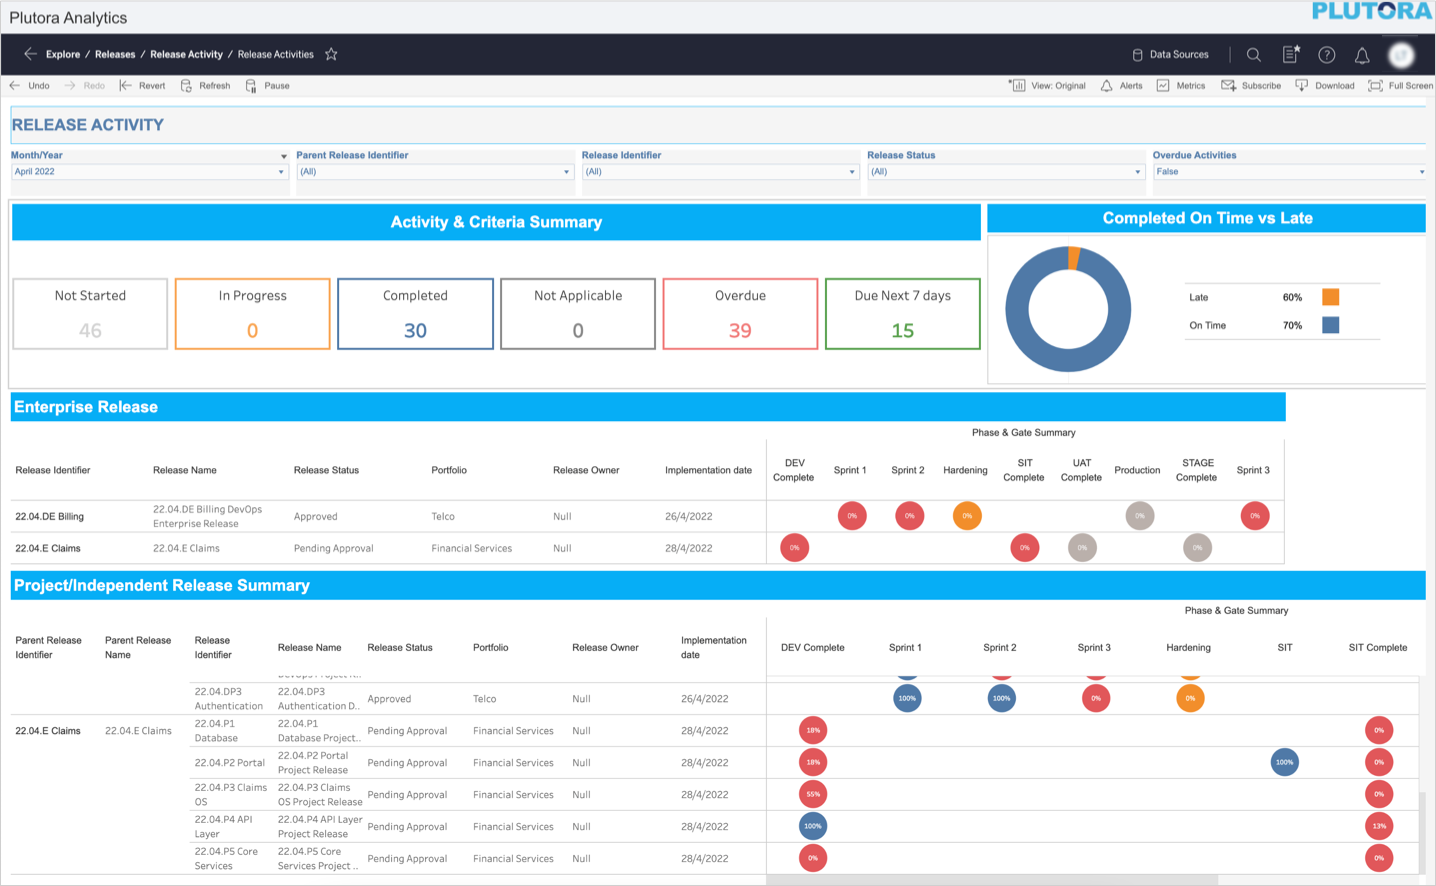
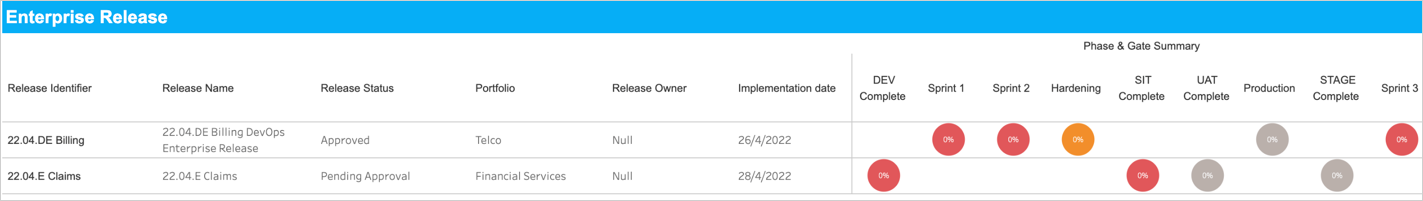
Release Activity Report

Introduction

Generate the ‘Release Activity’ report to view the status of the Activities and Criteria across all the Releases within the current or selected month. Using this report Release Managers can ensure that the process they have defined is being adhered to and can follow up on any Releases with overdue Activities and Criteria.

Pre-requisite

Ensure that you have added all the Activities/Criteria to the Release(s) and your data is up to date.

Reporting > Analytics > Releases > Release Activity > Release Activities

Alternatively, search for ‘Release Activity’ on the ‘Analytics’ page.

Access ‘Release Activity’ Report

To access the ‘Release Activity’ report navigate to Reporting > Analytics > Releases > Release Activity > and click Release Activities report.

The report will be blank until you select a month from the Month/Year filter field.

Filter Options

The filter fields provided in this report enable you to filter the data and generate the report as per your requirements. The following filter fields are available:

FieldsDescription
Month/YearMandatory; Select a month from the drop-down to populate the data.
Parent Release IdentifierSelect a parent Release from the drop-down. The drop-down options displayed are based on the Month/Year selected. Selecting ‘Null’ displays only the Non-Enterprise Releases.
Release IdentifierSelect one or more Releases from the drop-down. The drop-down options displayed are based on the above selected filter options. Then click Apply.
Release StatusSelect one or more statuses from the drop-down and click Apply.
Overdue ActivitiesSelect ‘True’ to view the overdue Activities only. Selecting ‘False’ displays all the Activities/Criteria.

The report generates as per the filter applied.

Release Activity Report –  In Detail

Activity & Criteria Summary

‘Activity and Criteria Summary’ section displays the count of Activities/Criteria in the following metrics:

  • Not Started
  • In Progress
  • Completed
  • Not Applicable
  • Overdue
  • Due Next 7 Days

Completed On Time vs Late

This pie chart displays:

  • the variance between the Activities completed on time and Activities completed late.
  • the percentage of the Activities/Criteria completed on time and late.
  • hover over the pie chart to view the count of Activities/Criteria.

Click on a segment on the pie chart to filter the Project/Independent Release Summary table accordingly.

Enterprise Release

The ‘Enterprise Release’ table displays the list of Enterprise Releases (as per the applied filter) and the Phases and Gates that belong to the respective Enterprise Release.

You can view the following information in this table:

  • the Enterprise Release ID and Name with its status.
  • the Portfolio associated with the Release and the Release Owner.
  • the Implementation Date.
  • Phase & Gate Summary. 

Phase & Gate Summary

The ‘Phase & Gate Summary’ section in the table displays the following information:

  • the list of the Phases and Gates applicable to each Enterprise Release based on the filter applied.
  • for each Phase/Gate, the percentage of Activities/Criteria that are Completed or Not Applicable is displayed.
  • hover over the Harvey Balls to view the details of the Phase/Gate. For details on Harvey Ball color coding, see Color Coding.
  • clicking on the Harvey Balls navigates to the ‘Activity List’ page. This page displays the list of Activities/Criteria for that Phase/Gate with its Status, Compliance, and Implementation Dates.

Click Back to Dashboard to navigate back to the report.

The Phases and Gates ordered on the ‘Enterprise Release’ table are based on the earliest Phase/Gate start date.

Project/Independent Release Summary

This table displays the list of Project/Independent releases grouped by the Enterprise Release, if applicable.

On this table you can view:

  • the linked Enterprise Release ID and Name, if applicable.
  • the Release (Project/Independent) ID and Name with its status.
  • the Portfolio associated with the Release and the Release Owner.
  • the Implementation Date.
  • Phase & Gate Summary. For details, see Phase & Gate Summary

More Information

Color Coding

The color coding applied to the percentage summary is as follows:

  • Gray = Phase/Gate start date is in the future.
  • Green = Phase/Gate start date is in the past and Phase/Gate end date is in the future and there are NO overdue Activities/Criteria in a ‘Not Started’ or ‘In Progress’ status (Overdue Activity = Current date/time > Activity/Criterion Due Date).
  • Amber = Phase/Gate start date is in the past and Phase/Gate end date is in the future and there are overdue Activities/Criteria in a ‘Not Started’ or ‘In Progress’ status (Overdue Activities = Current date/time > Activity/Criterion Due Date).
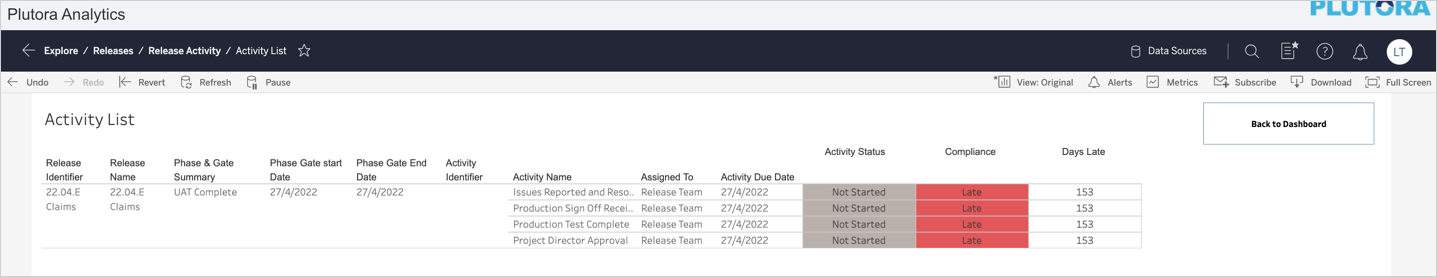
  • Red = Phase/Gate end date is in the past and there are overdue Activities/Criteria in a ‘Not Started’ or ‘In Progress’ (Overdue Activity = Current date/time > Activity/Criterion Due Date).
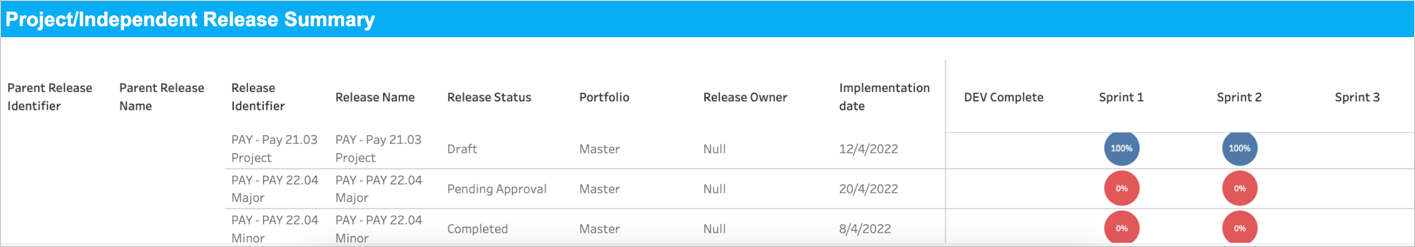
  • Blue = Phase/Gate end date is in the past and all Activities/Criteria are in a ‘Completed’ or ‘Not Applicable’ status.

Clear the Filter

If you have applied a filter on a field, hovering over that field displays . Click on it to clear the filter applied to that field.

Related Articles

Contents

Be the first to find out about new features. Subscribe to the Release Notes email.

Was this article helpful?

Thanks for your answer!