
Release Forecast Report – In Detail
Count of Releases vs Count of Changes Graph
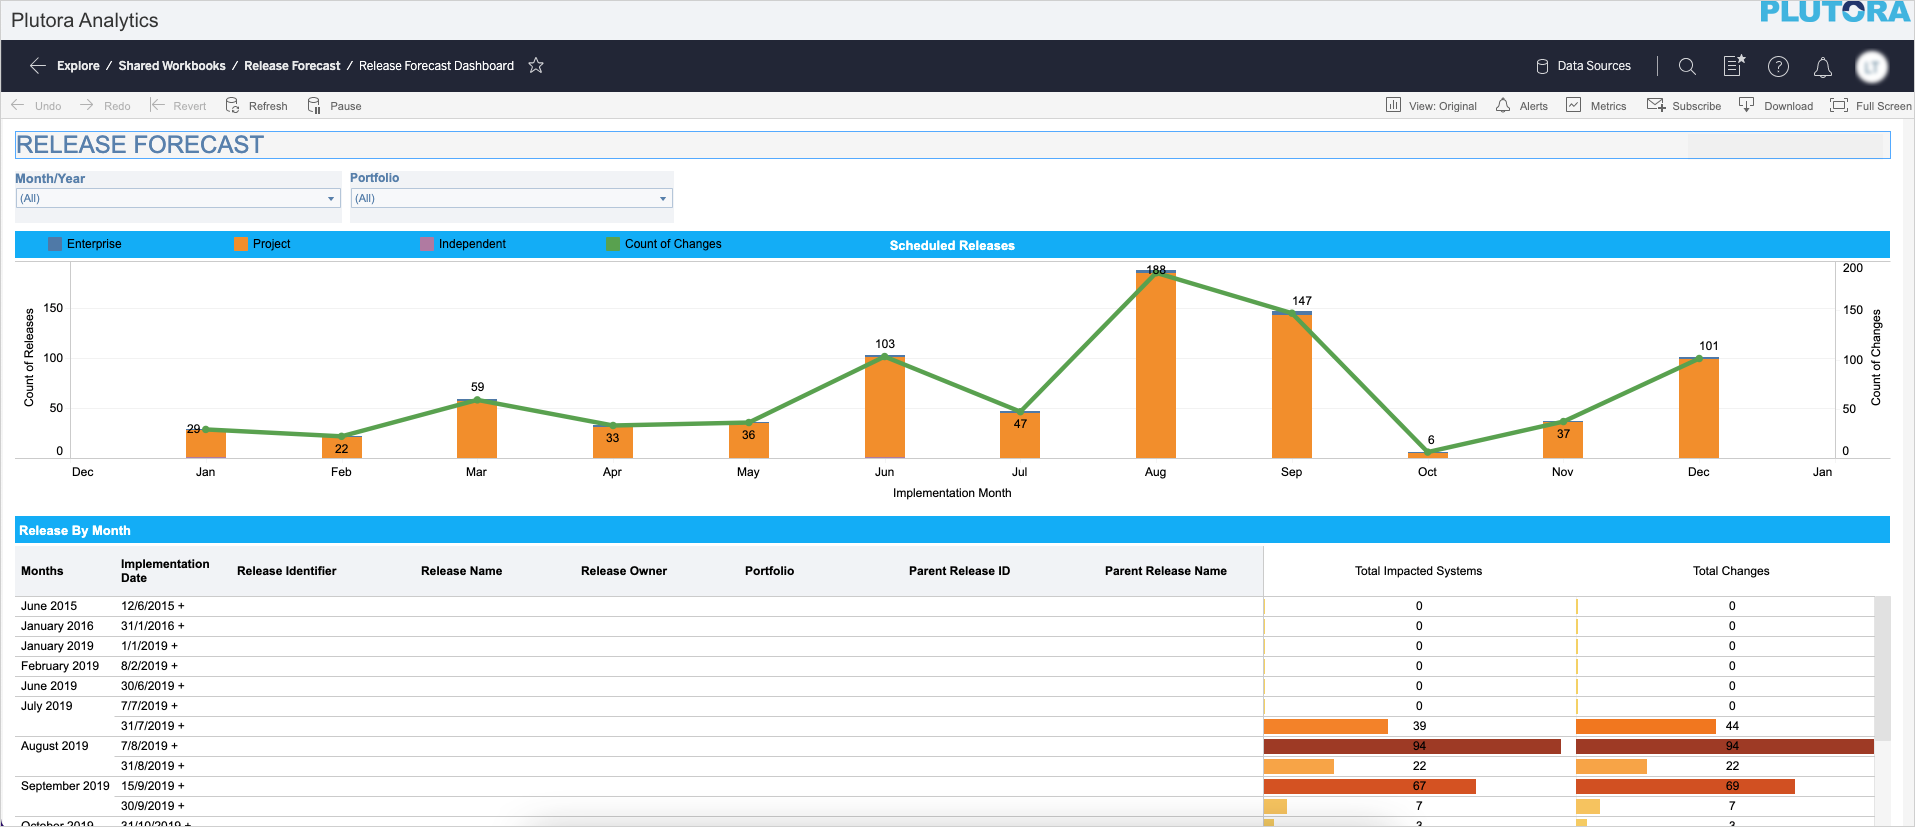
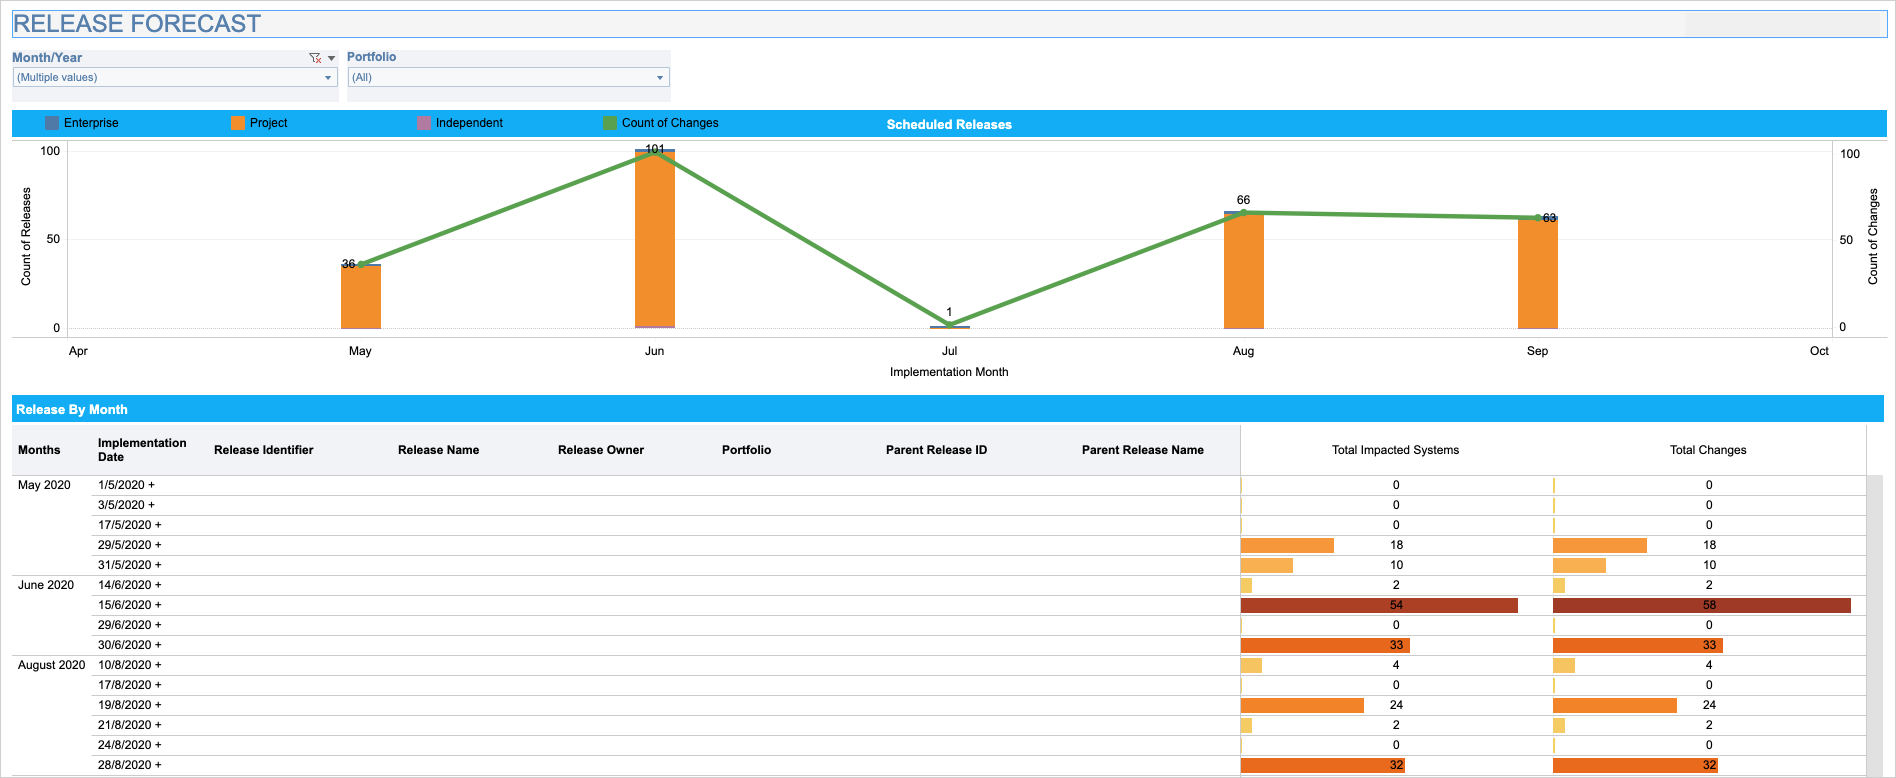
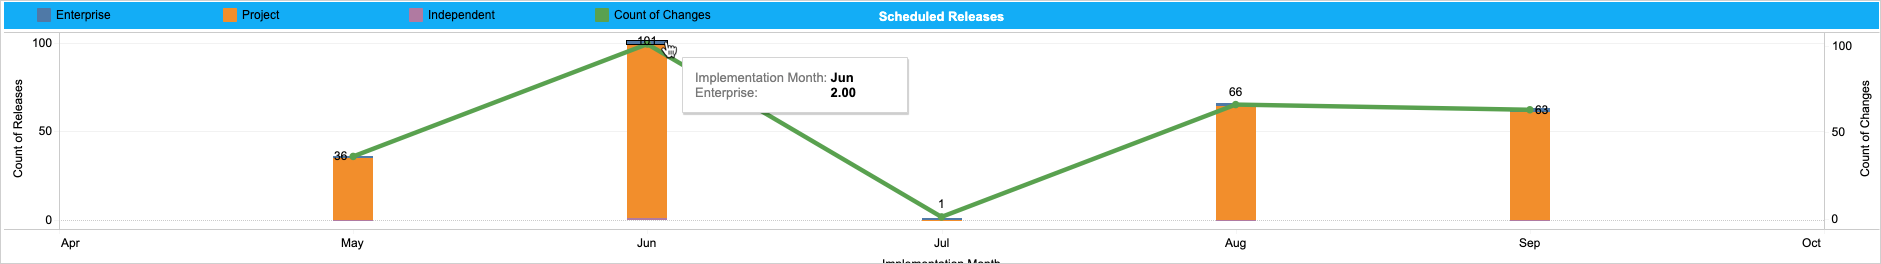
This graph shows the number of Scheduled Releases and Changes associated with those Releases(s) for the selected month(s).
From this Chart, you can identify which month has the highest number of Changes and which has the least. Hover over the bar to view the count of Enterprise, Project, and Independent Releases in each month.
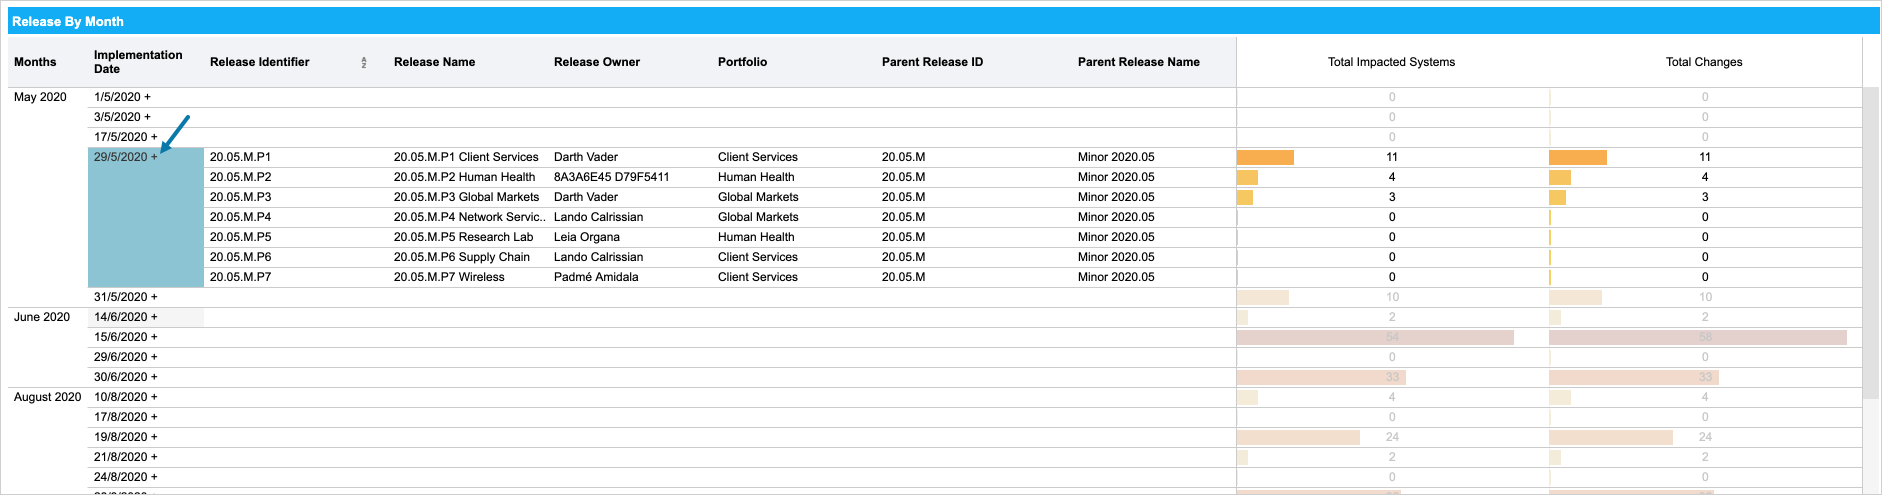
Release by Month Table
This table lists the Releases planned per month (as per the filter applied). Click + next to the Implementation Date to view:
- list of the associated Project Releases and their name and ID.
- Release owner details
- the parent Release ID and Name (Enterprise Release or Non Enterprise Release)
- total number of System(s) impacted by each Release. Hover over the Impacted Systems bar to view the details of the System.
- total number of Changes per Release. Hover over the Changes bar to view the details of the Changes.
More Information
Clear the Filter
If you have applied a filter, hovering over that field displays ![]() . Click on it to clear the filter applied to that field.
. Click on it to clear the filter applied to that field.