
Access ‘Release Manifest’ Report
To access the ‘Release Manifest’ report navigate to Reporting > Analytics > Releases and click Release Manifest report.
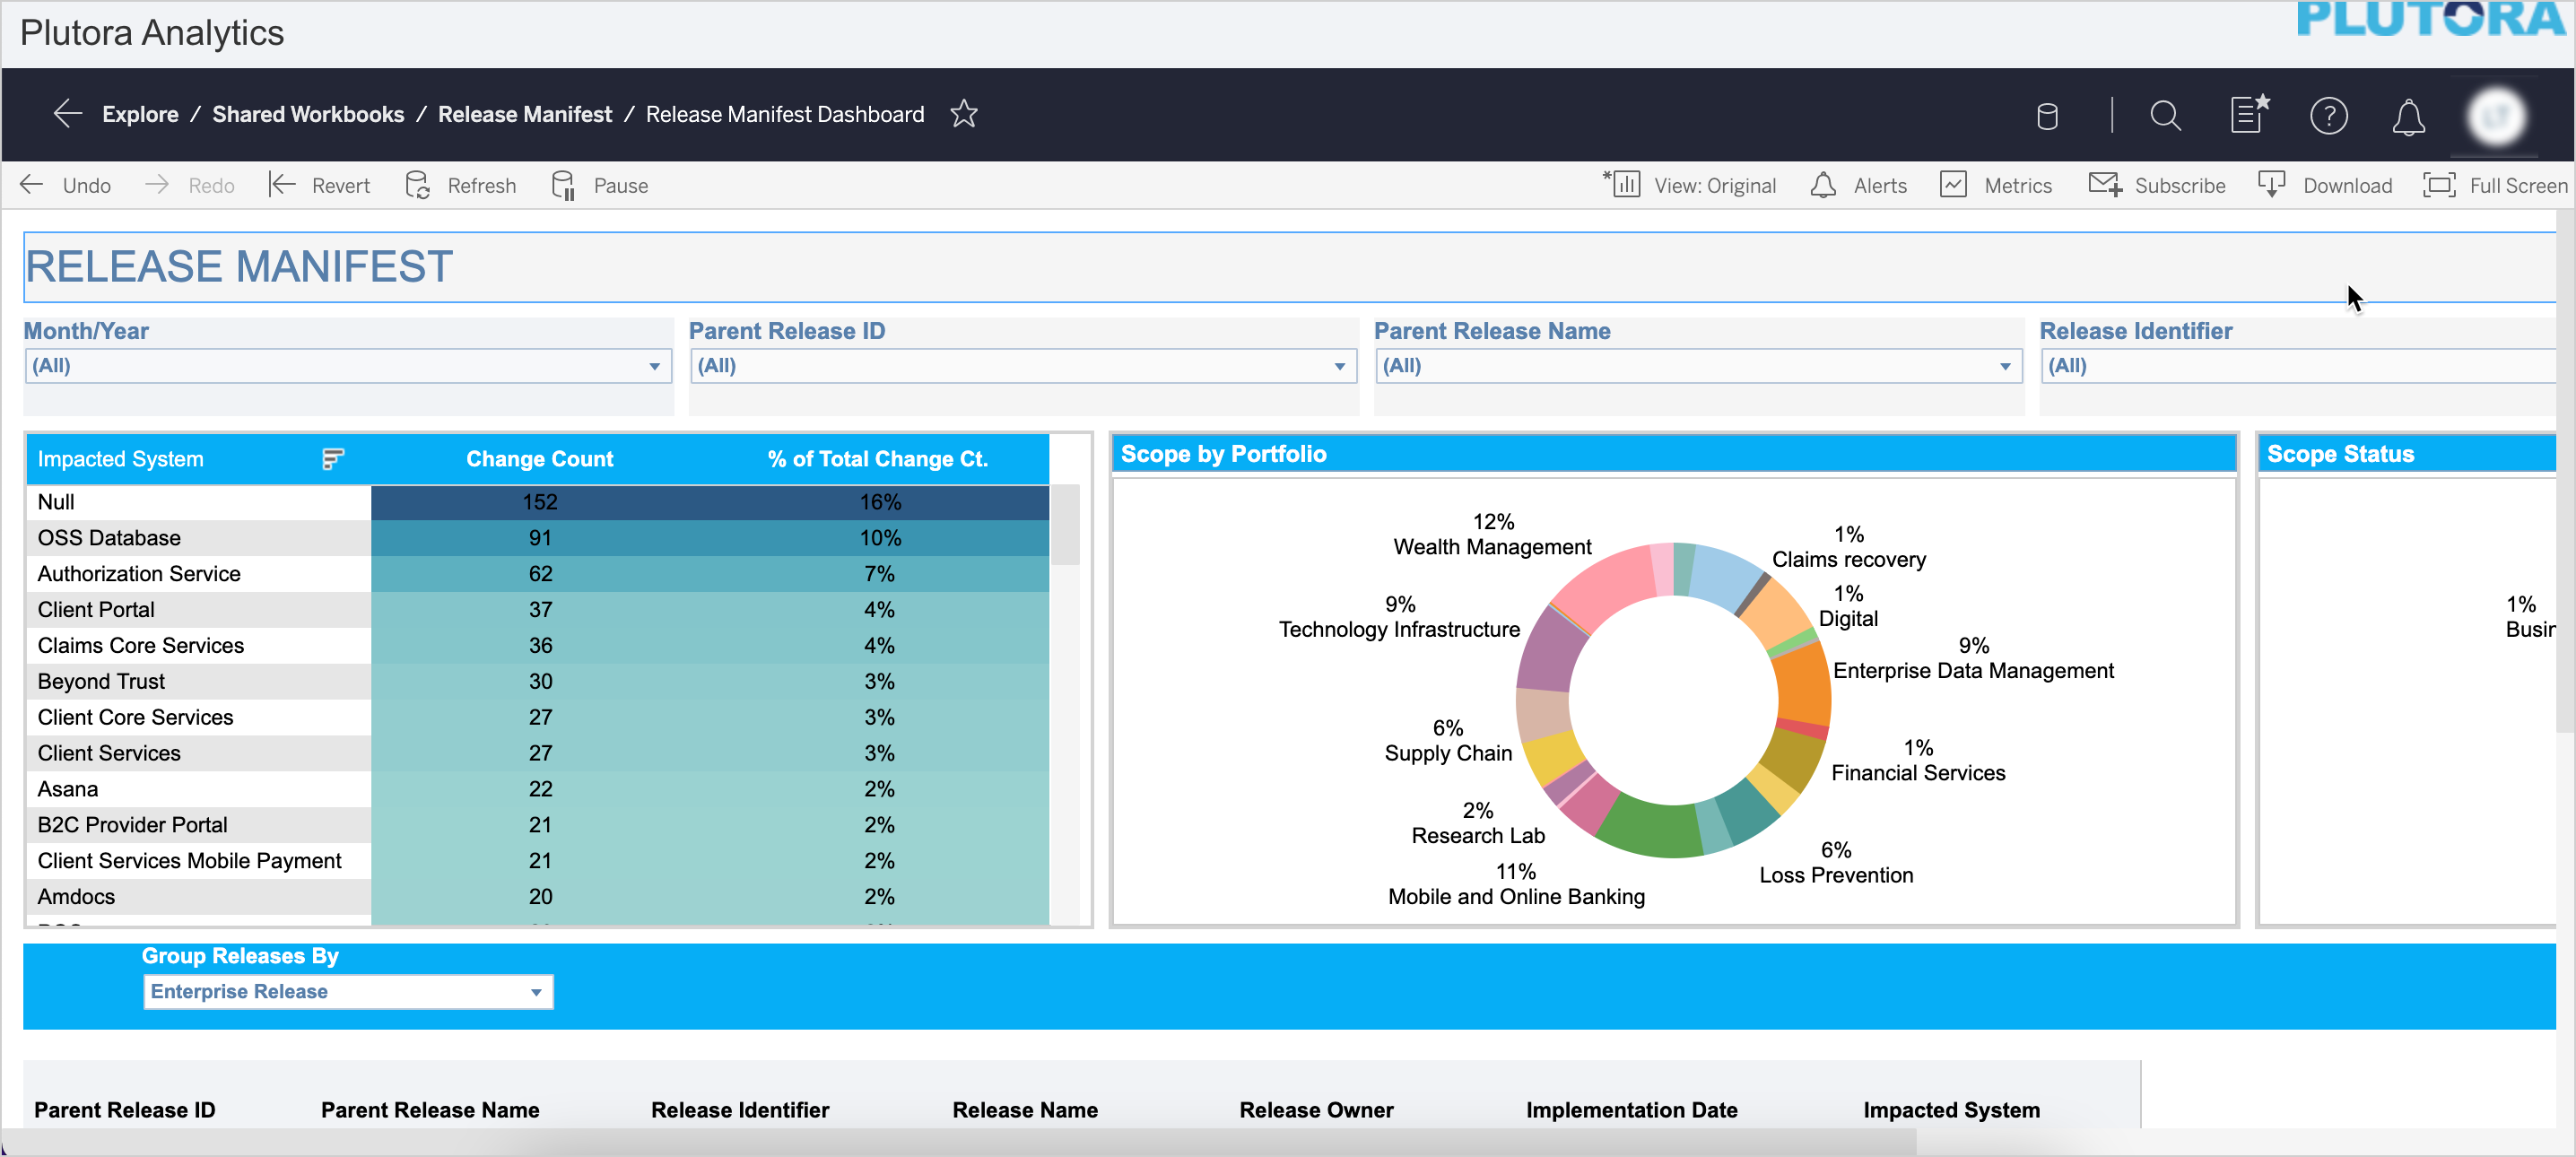

Release Manifest Report – In Detail
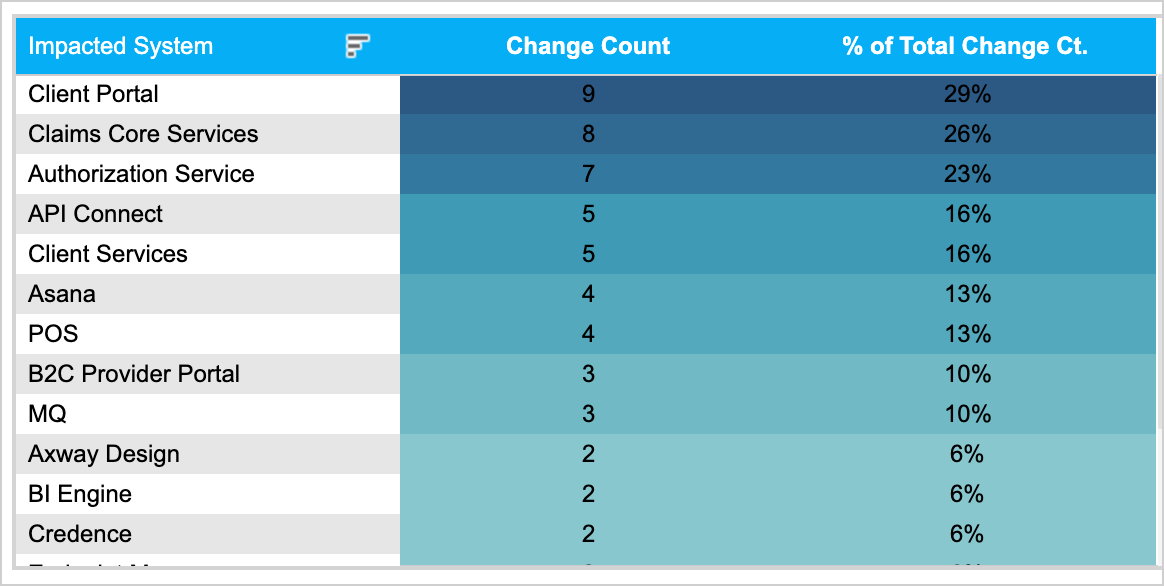
Impacted System Table
This table shows the following information:
- the list of Systems that are impacted by the selected Release(s).
- the count of Changes impacting each system.
- the % of total Change count per impacted Systems that are part of the Release(s).
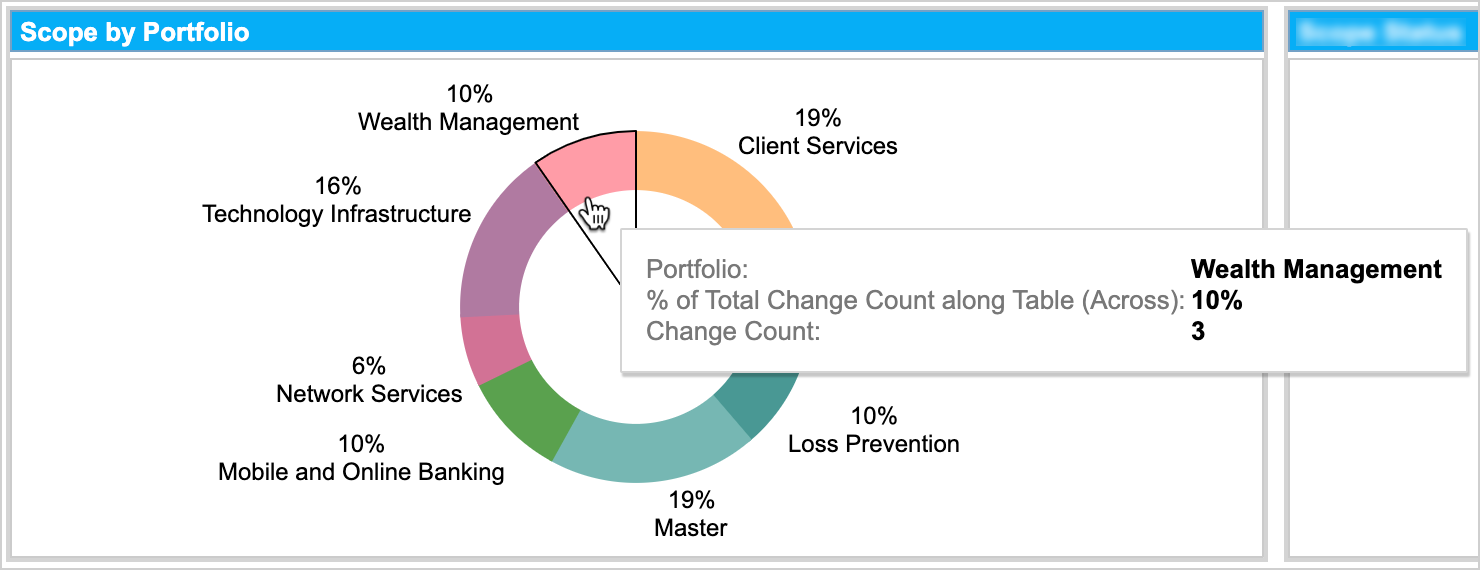
Scope by Portfolio Chart
This pie chart displays
- the Portfolios associated with the Changes
- % of the scope items per Portfolio
- hover over the pie chart to view the number of Changes per Portfolio.
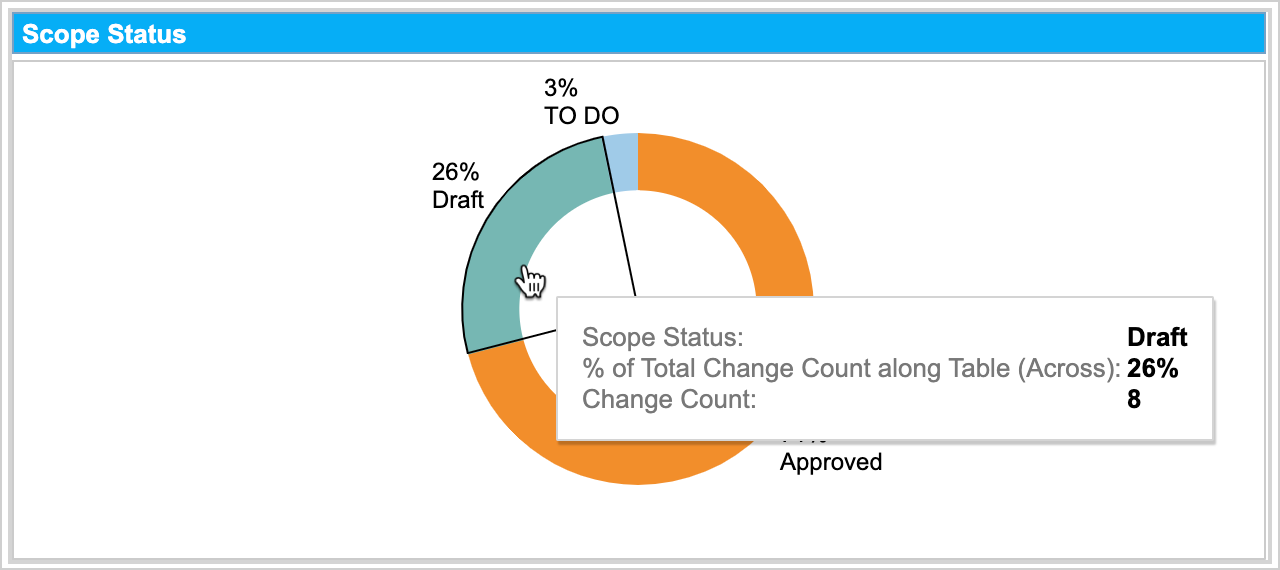
Scope Status Chart
This pie chart displays
- Status of the associated Changes
- % of the Changes per Status
- hover over the chart to view the count of the Changes per Status.
Scope Items per Release Table
This table lists the Enterprise and Non-Enterprise Releases that are being released (as per the filter applied). You can group this table by the ‘Enterprise Release’ or ‘Monthly’. Click Group Releases By and select an option from the drop-down.

Click + to expand the Release to view the following information:
- list of the associated Project Releases and their name and ID.
- Release owner details
- The Implementation Date
- System(s) impacted by each Release
- Number of Changes (‘Count of Scope’ column) and their status per Release.
The Count of Scope is color-coded by the Status of the Scope items. Hover over the Scope item bar to view the details.
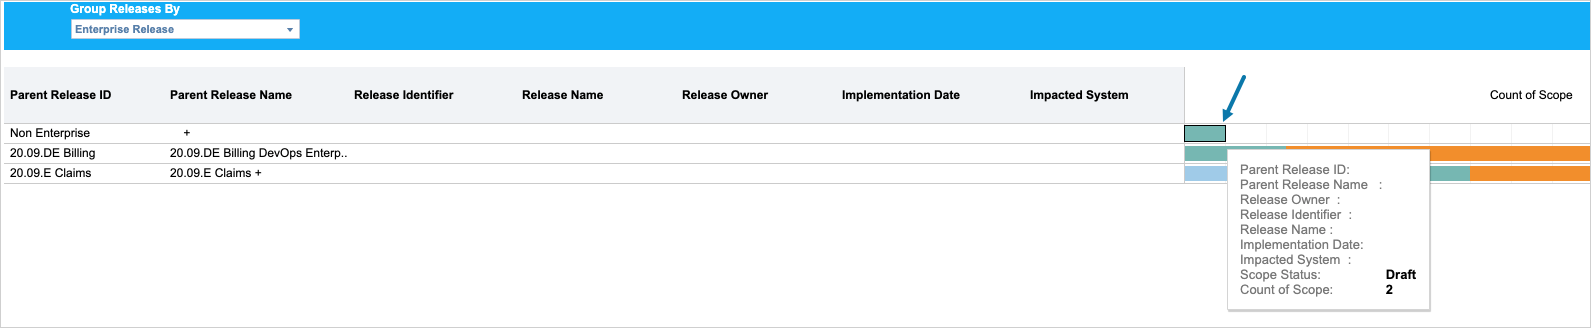
The Independent Releases are included and displayed within ‘Non Enterprise’. Expand Non Enterprise to view the list of Independent Releases and its details on the table.
More Information
Clear the Filter
If you have applied a filter on a field, hovering over that field displays ![]() . Click on it to clear the filter applied to that field.
. Click on it to clear the filter applied to that field.